Google Analytics 4 is completely different (look and function) so it can be really overwhelming to start digging in. So for that here are some tips to help you feel more comfortable and better use GA4.
Smart 1: Make the reporting UI work for you!
It’s only now in GA history, that GA4 allows you to actually modify the UI, both the left navigation organization reports and report under them. This signifies you can do things like build out reports collections for specific teams so they have a clear place to go for their reporting needs.
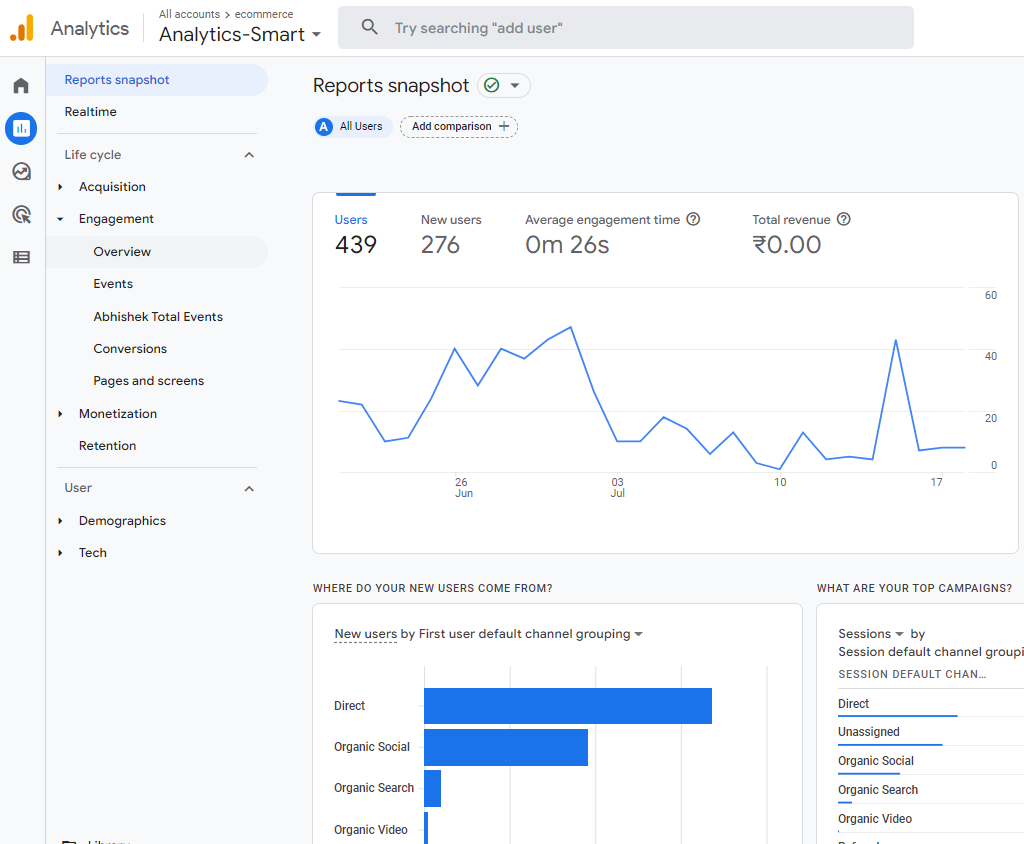
These all modifications can be done yourself while navigating to the “Library” section of GA4 (bottom left-hand nave when you are in the “Reports” section). You must have admin on the account to make these changes.
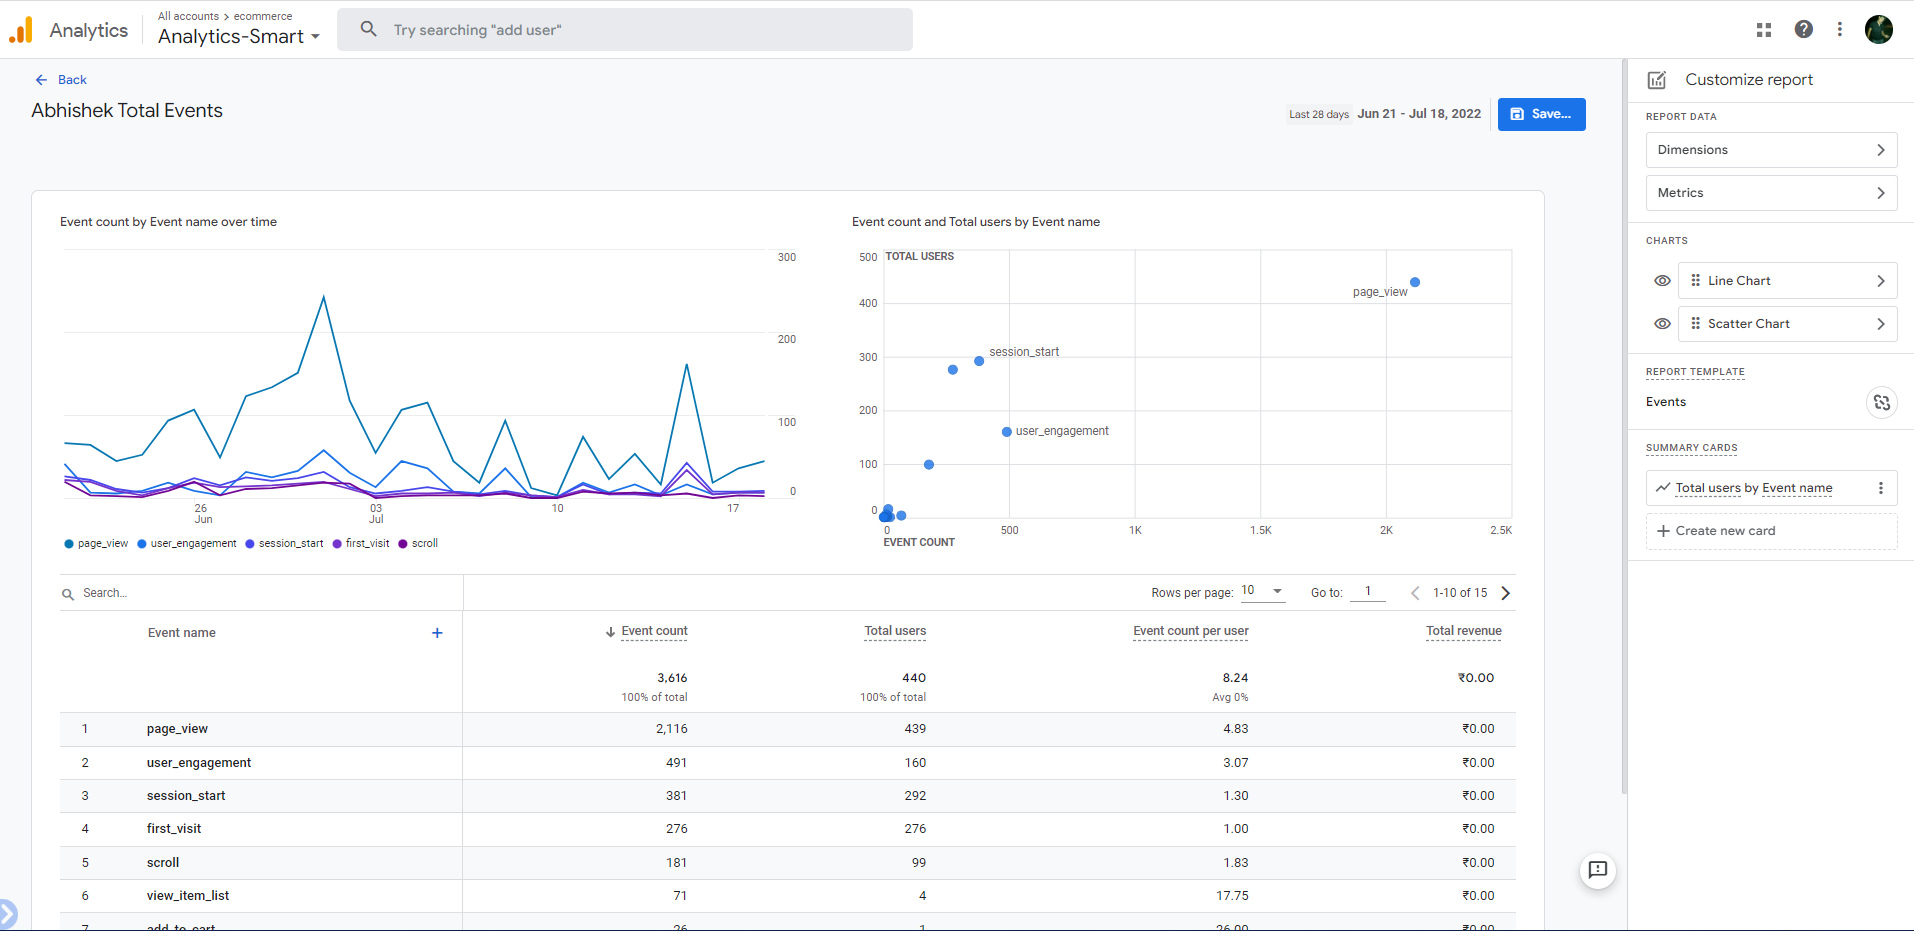
Smart2: You can choose your favorite graphs
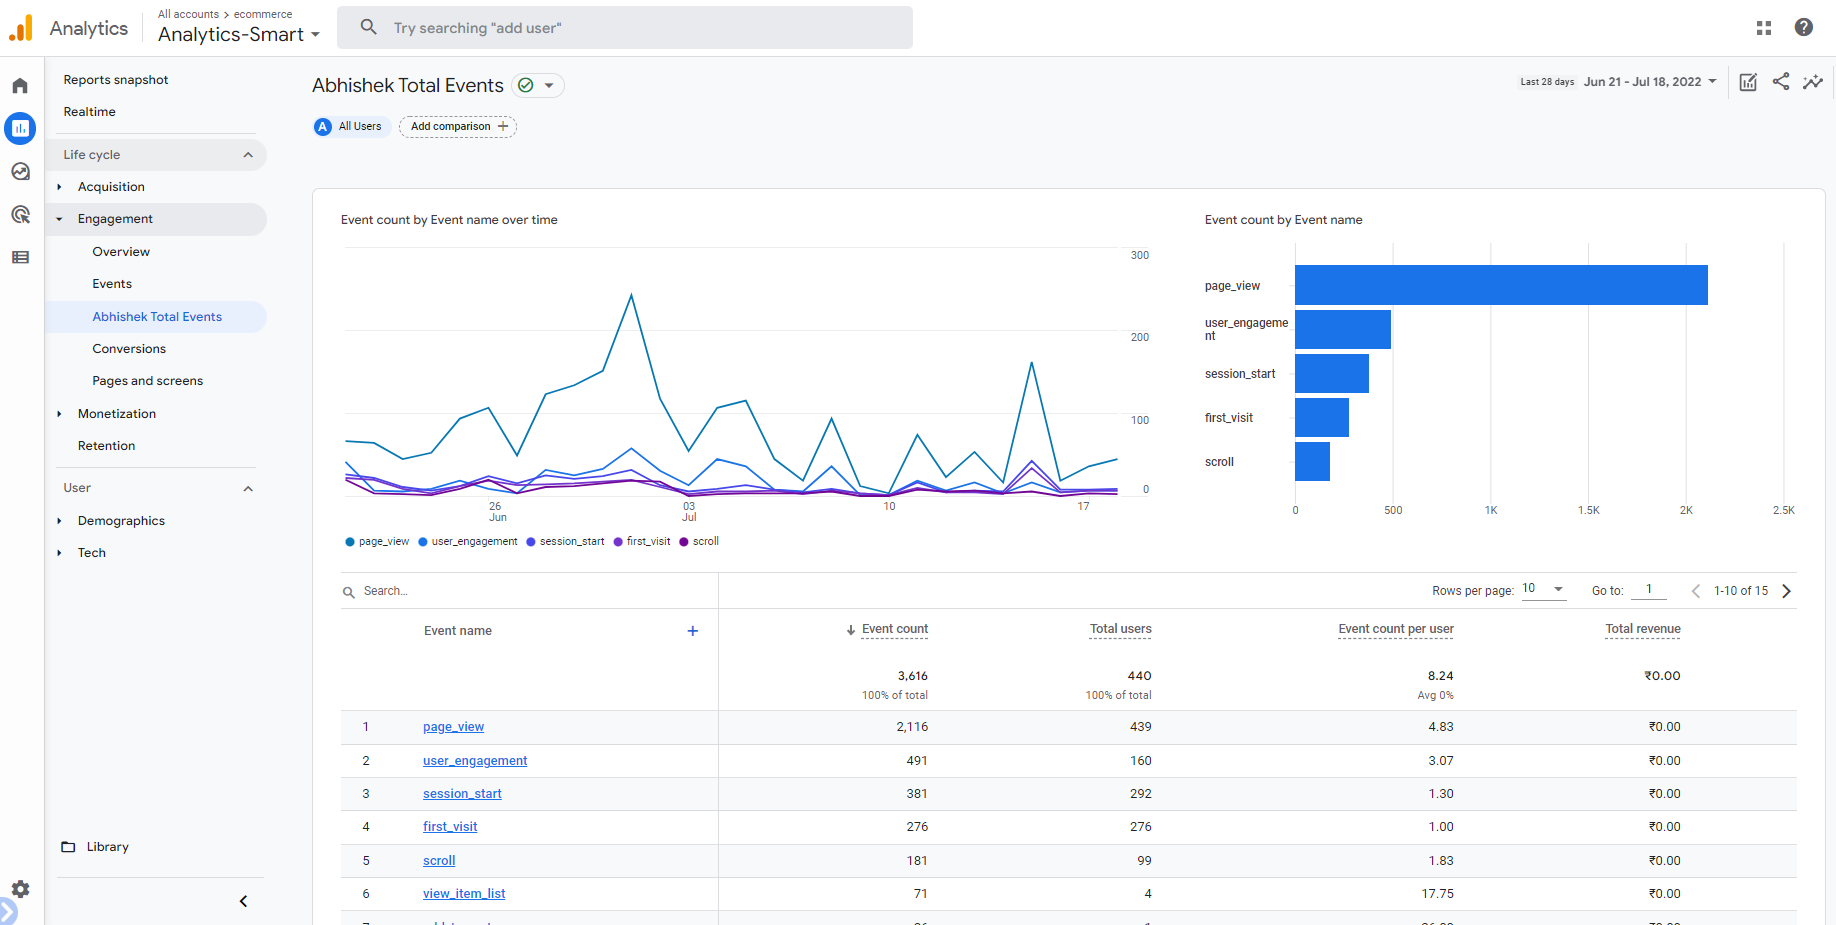
In GA4 reporting, you can change the chart type on each report. Out of the box, each table report comes with either a line chart or bar chart AND a scatter plot. I am using a Google demo account for report creation
Smart3: View event details (parameter values) in real-time reporting
There is great real-time debugging, and real-time reporting in GA4 provides you with invaluable knowledge that can be used to test your marketing campaign, troubleshoot in real-time, monitor web traffic, and verify your goals.
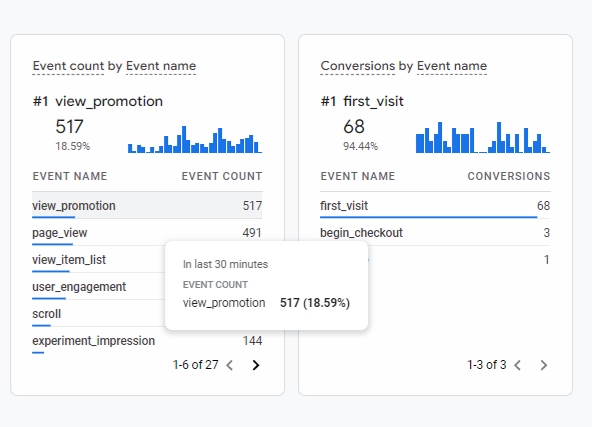
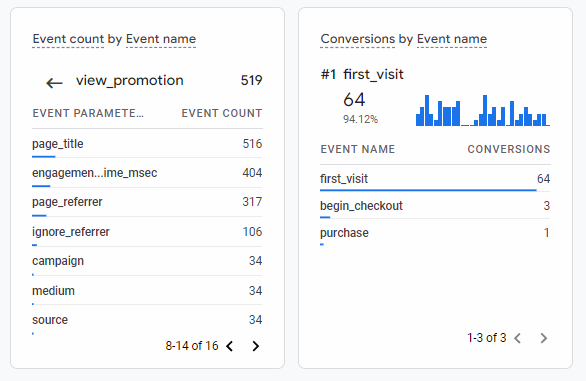
View Promotion parameter values listed
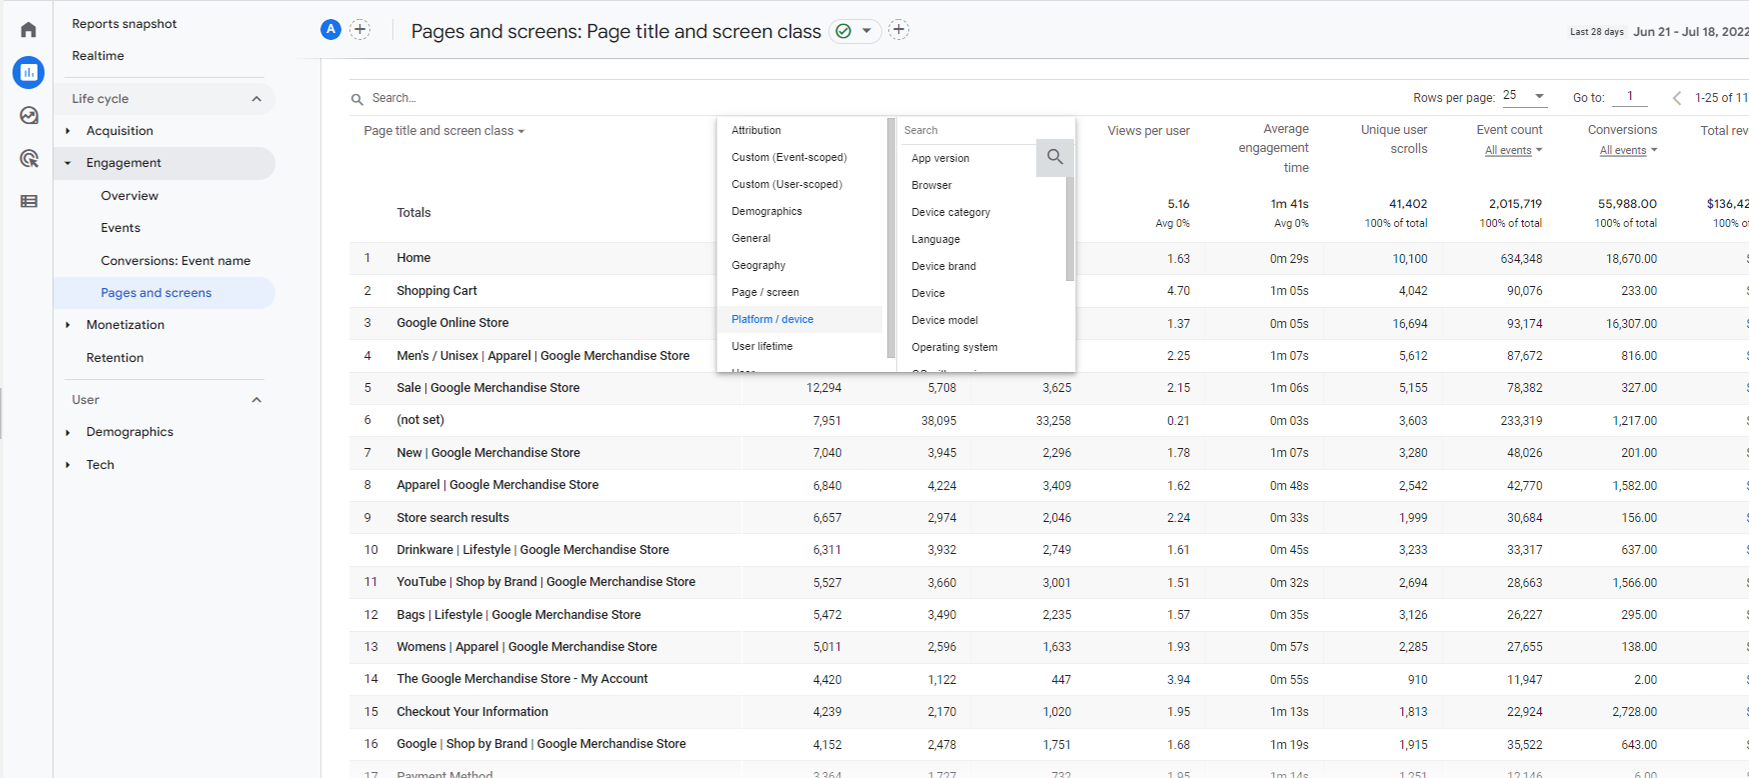
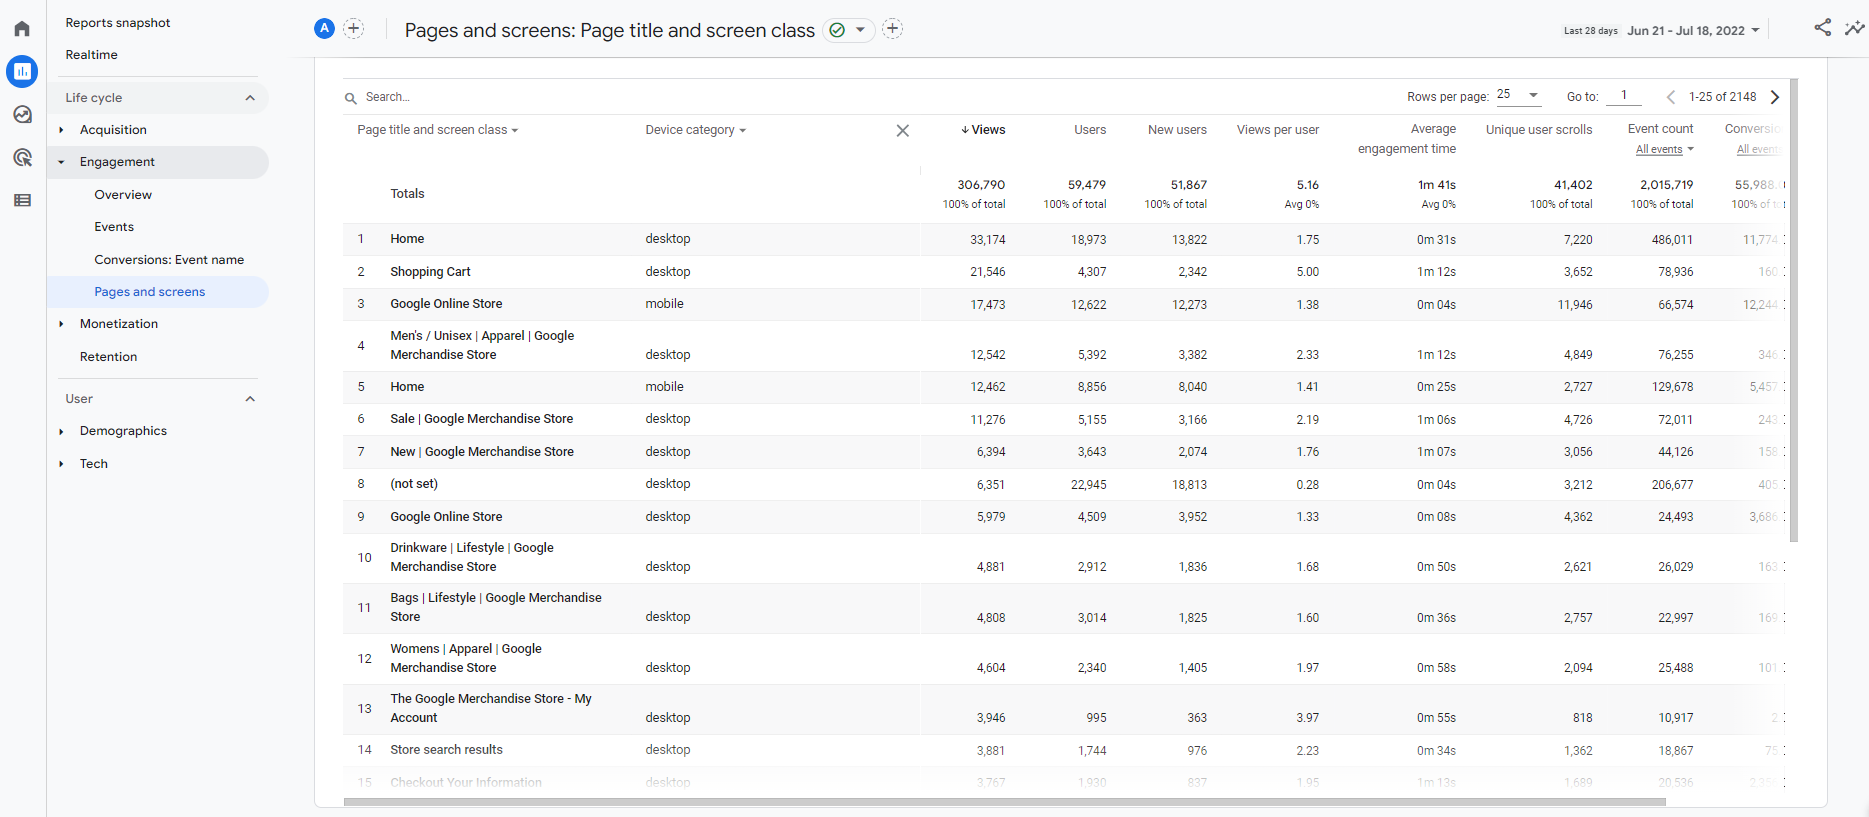
Smart4: Dive deeper with Secondary Dimensions
You can take your analysis to the next level using Secondary Dimensions to break down each row of data in a table. For example, I could breakdown the Page by the device category someone visited the page by
Secondary dimensions in Details
Selecting a Custom dimension for a device category
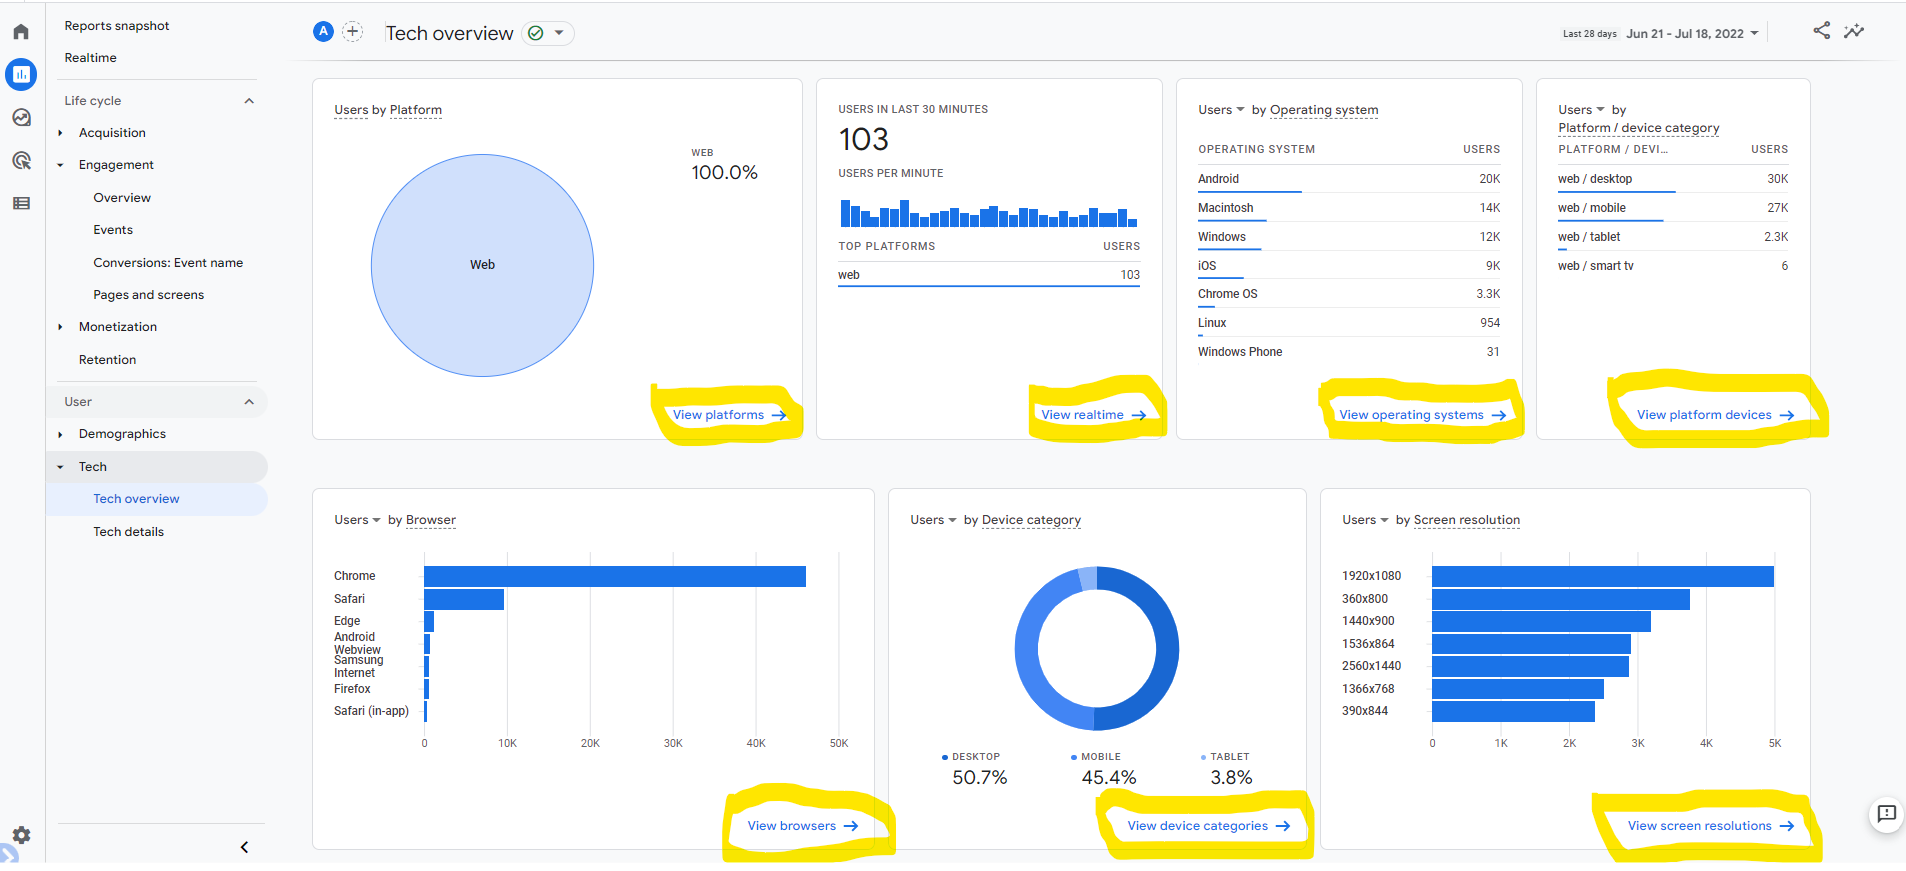
Smart5: Details are hidden, but they’re in GA4
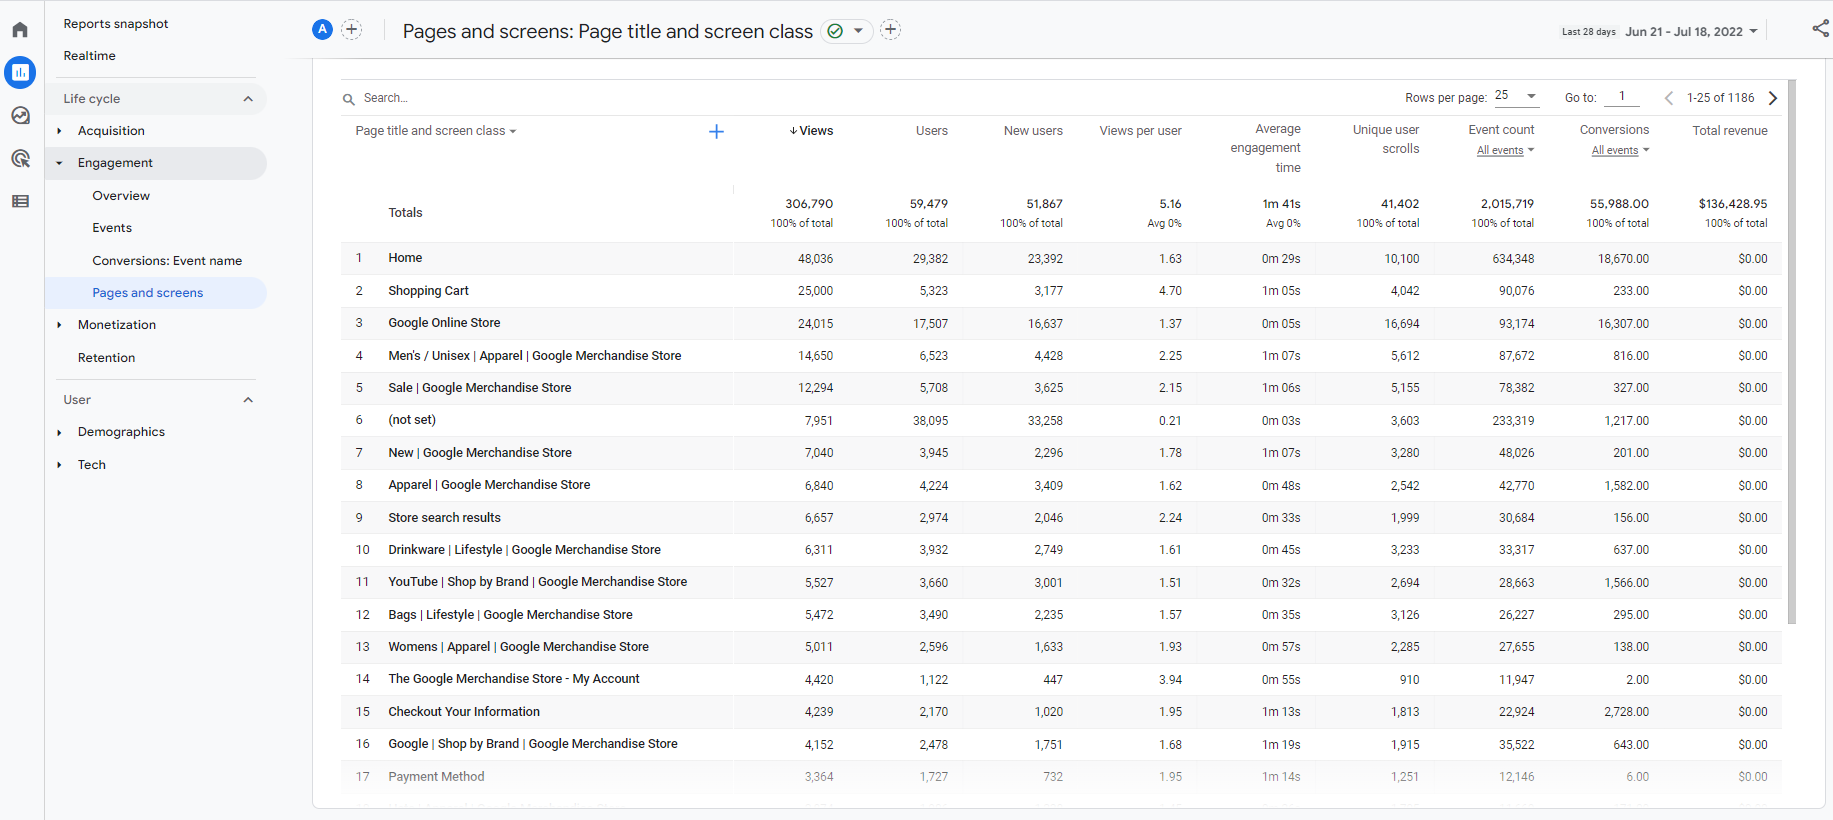
In Universal Analytics, there was n number of reporting options available where you can see several different dimensions to focus on. Take an example- the technology report had so many dimension options! On the surface, GA4 looks sparse.. but you can find more dimension options in each table report and by clicking through widgets in any of the Overview reports.
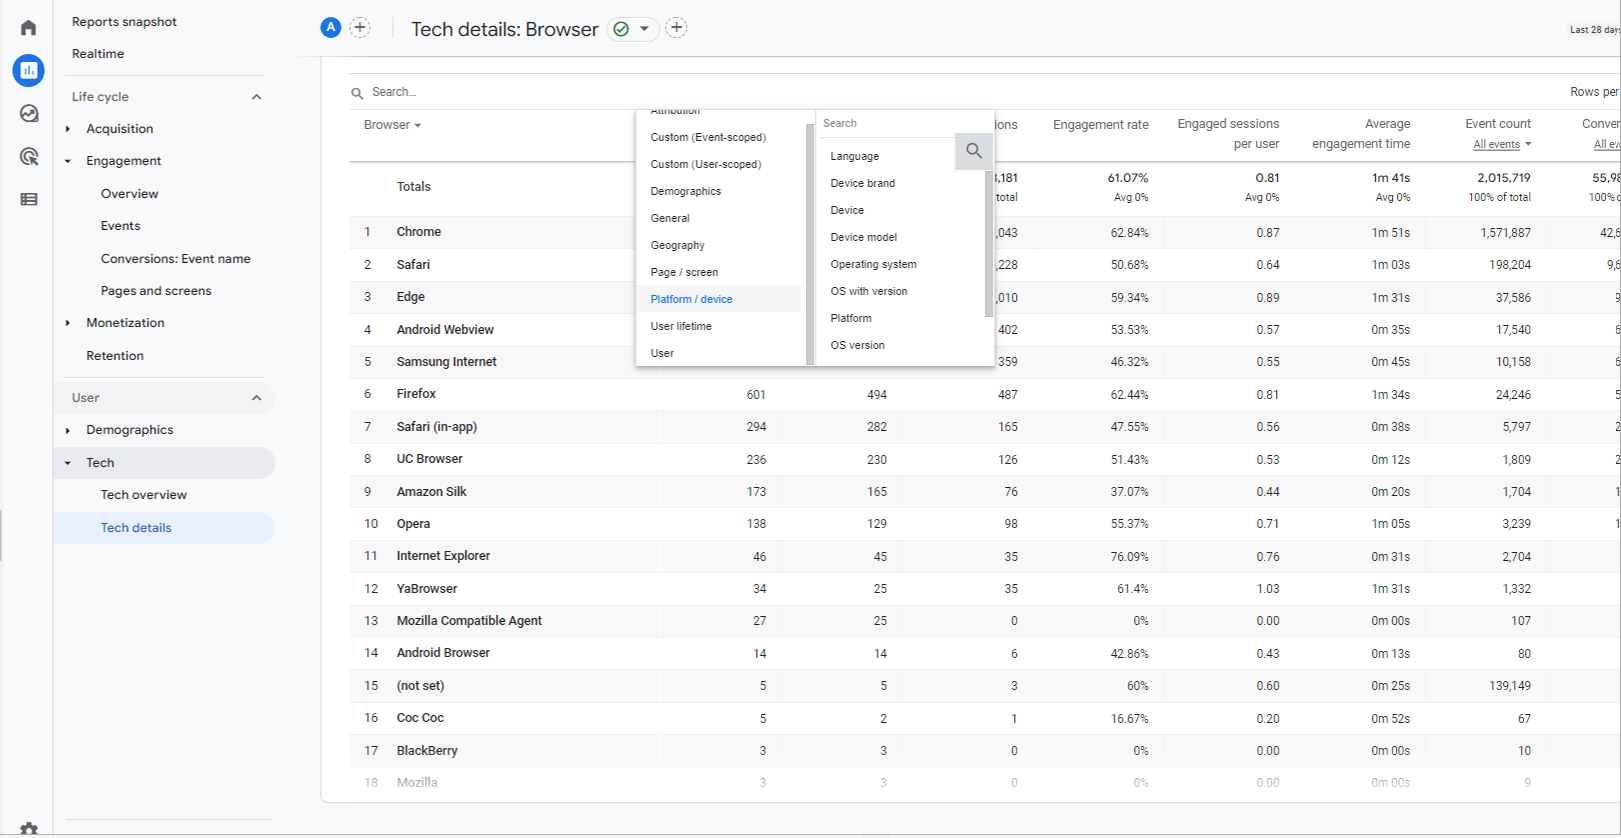
Clicking links goes to full table report for this dimension