What is a dimension?
Google Analytics Dimension is a parameter/characteristic or attribute of data. It can be an attribute of a user, event, product, website, or application. It helps to understand the data in a structured way and make a view around the collected metrics.
User Dimension:
- User_ID
- Loyalty
- Lifetime value
Events Dimensions
- Category value
- Page Title
- Page Type
Product Dimensions
- Product Name
- Product Category
- Product Sub-category
- Product Offer
- Product variant
To add, dimension describes the data received for analysis. Now, what about custom dimensions?
Custom dimension represents additional attributes to track with data that which default method can not and helps in analytics activities
Table of Contents
- What is a dimension?
- Point 1: GA4 =! GA3
- Point 2: Understanding and exploring GA4
- Point 3: Use them in the Query Explorer
- Point 4: Leverage them in Comparisons
- Point 5: Build Powerful Segments
- Point 6: Build Powerful Audiences
- Tip 7: Export Them via the Data API
- Point 8: Set up Custom Dimensions and Metrics
- Point 9: BigQuery Power to Analytics
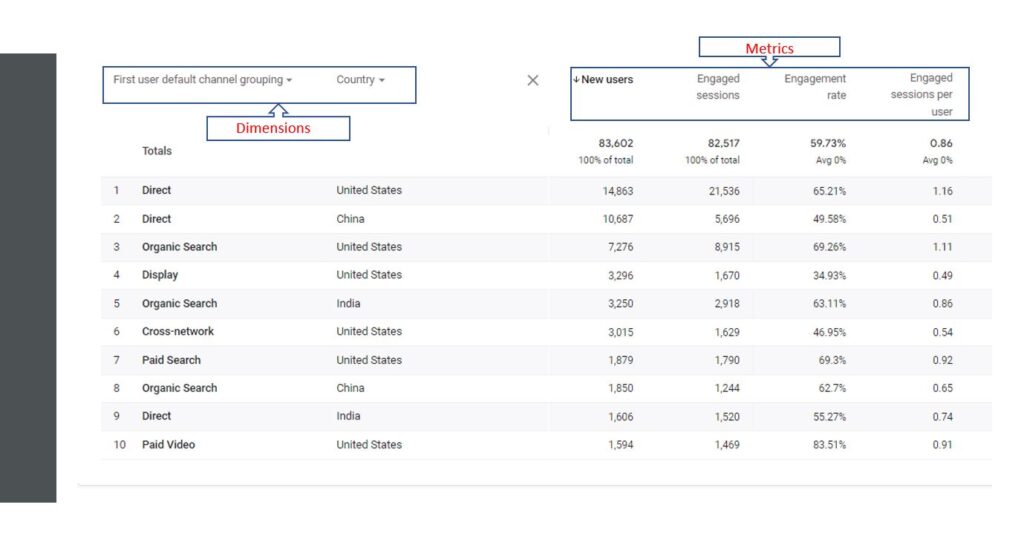
This report consists of:
- Two dimensions: Session Default Channel Groupings and Country
- Three metrics: Users, Sessions, and Engaged sessions
By default, Google Analytics 4 shows just one dimension in standard reports.
You can add an additional/secondary dimension via the “+” sign next to the primary dimension.
Point 1: GA4 =! GA3
- There are far fewer (default) metrics and dimensions available in GA4.
- New metrics and dimensions are introduced and others have disappeared.
Did you know that bounce rate is not a default metric in GA4?
I know this has led to disappointment, but please keep in mind that the default bounce rate in GA3 isn’t the best metric. GA4 comes with better metrics in this area, but that’s a topic I will discuss in a separate post.
Just be aware that you need to change your mindset and be open when working with GA4. You can’t simply copy your metrics and dimensions strategy of GA3.
Point 2: Understanding and exploring GA4
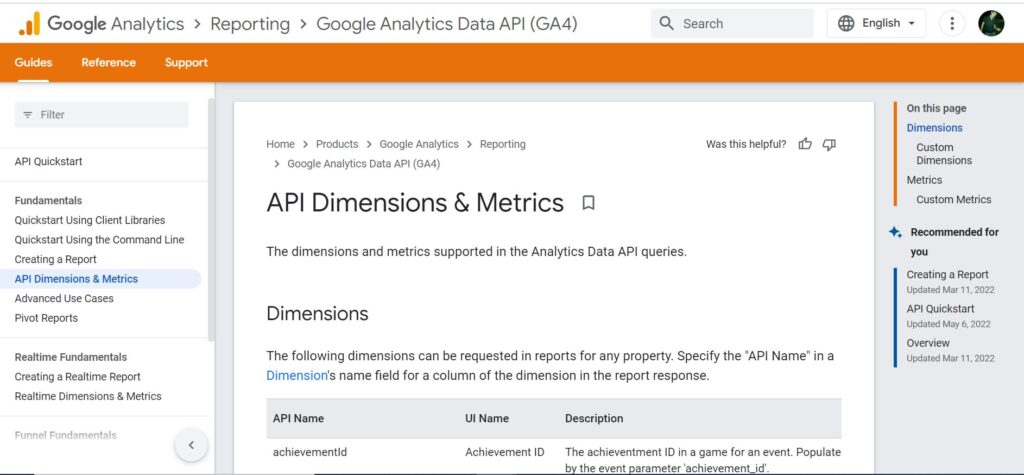
Visiting the GA4 Dimensions and Metrics Explorer is one of the best things you can do to get started.
Step 1: Navigate to the link above and select GA4
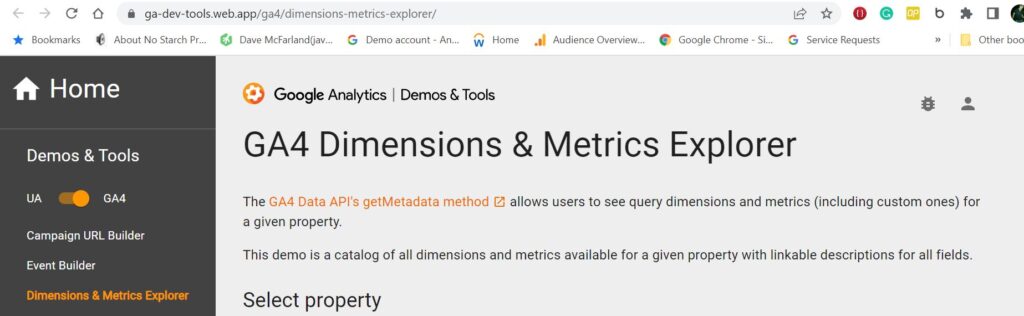
Step 2: You can select any GA4 property linked to your account
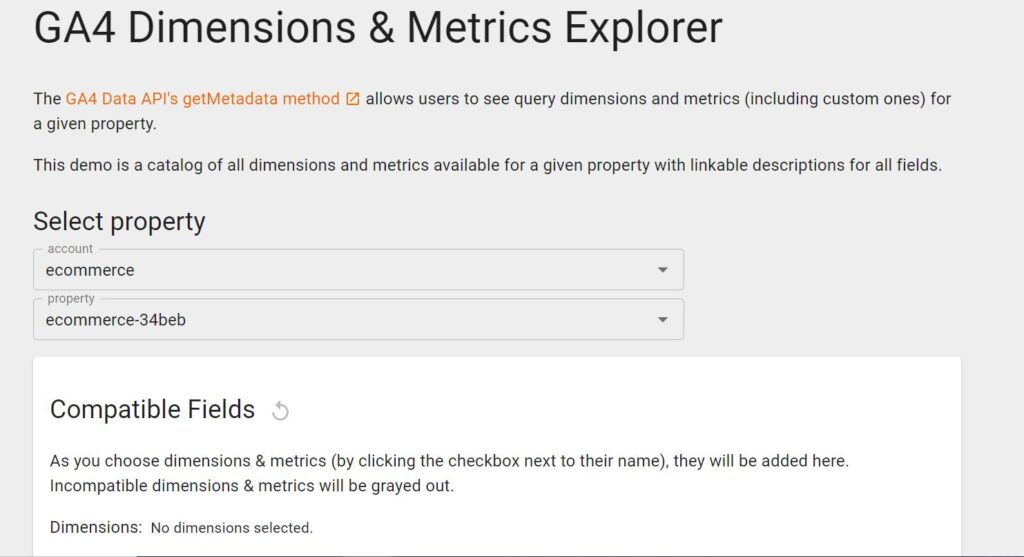
Step 3: Review all available dimensions and metrics
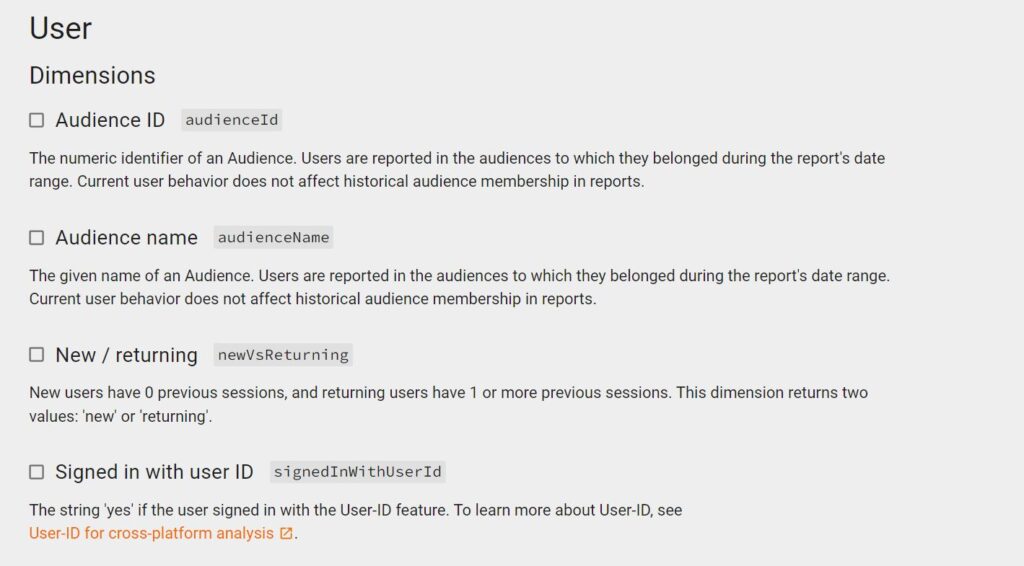
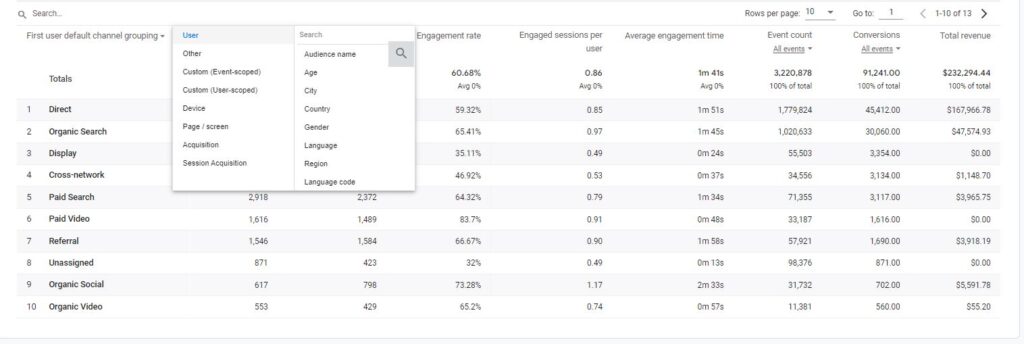
Tip: you can review non-default custom dimensions and metrics as well:
- Event-scoped Custom Metrics
- Event-scoped Custom Dimensions
- User-scoped Custom Dimensions
Point 3: Use them in the Query Explorer
Not all metrics and dimensions go together.
You have the option to explore potential queries in all depth in the GA4 dimensions and metrics explorer.

Looking for Cohort in the search field
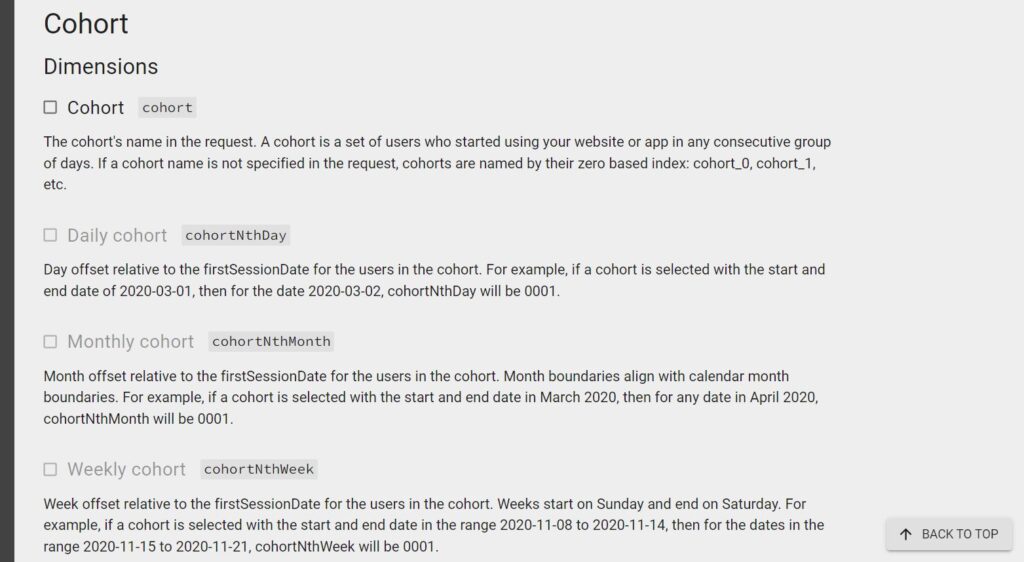
It turn out that addToCarts and checkouts don’t go together with cohortNth dimensions.
In addition to the above, you can use the GA4 Query Explorer directly to do some pre-work on building queries.
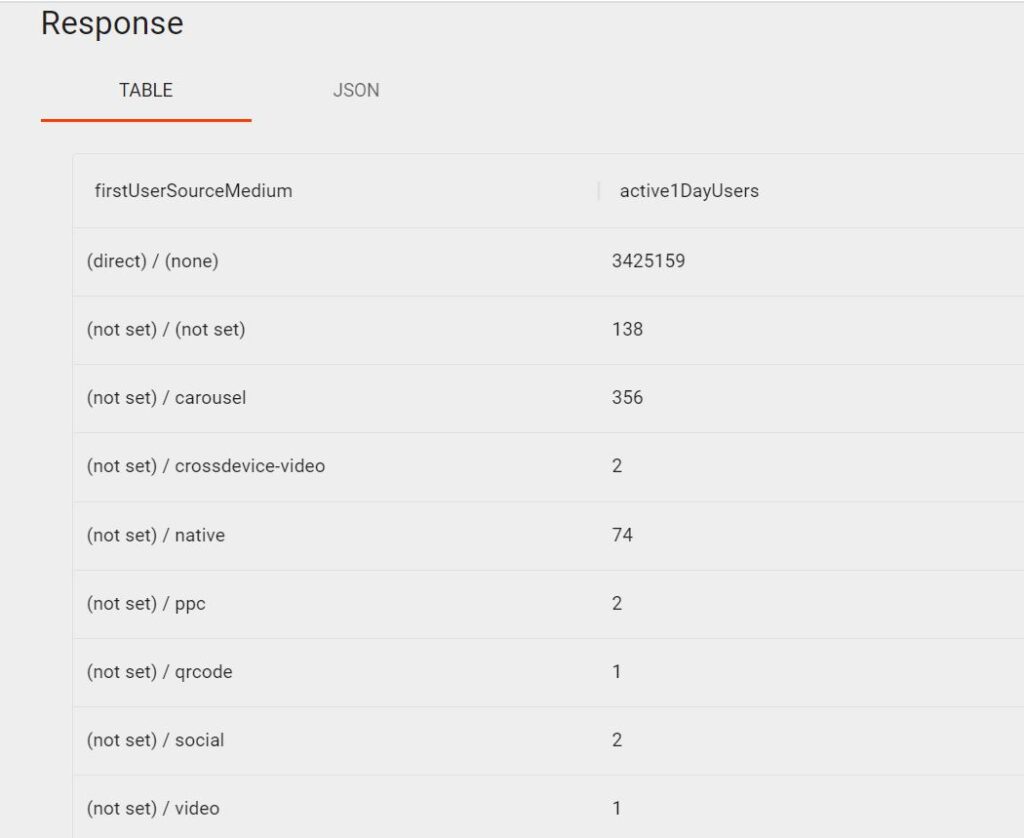
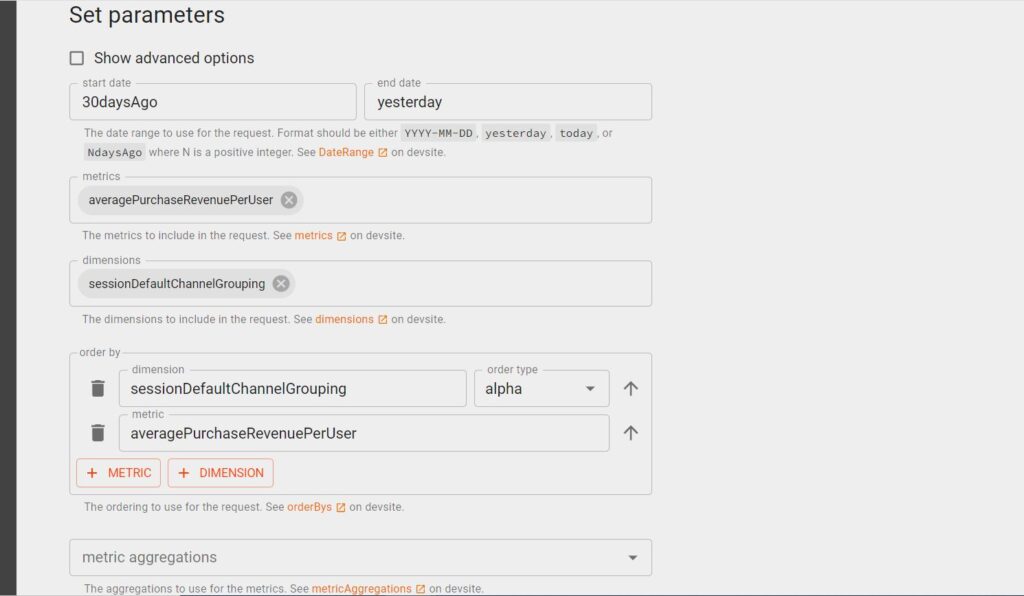
Query Explorer – request
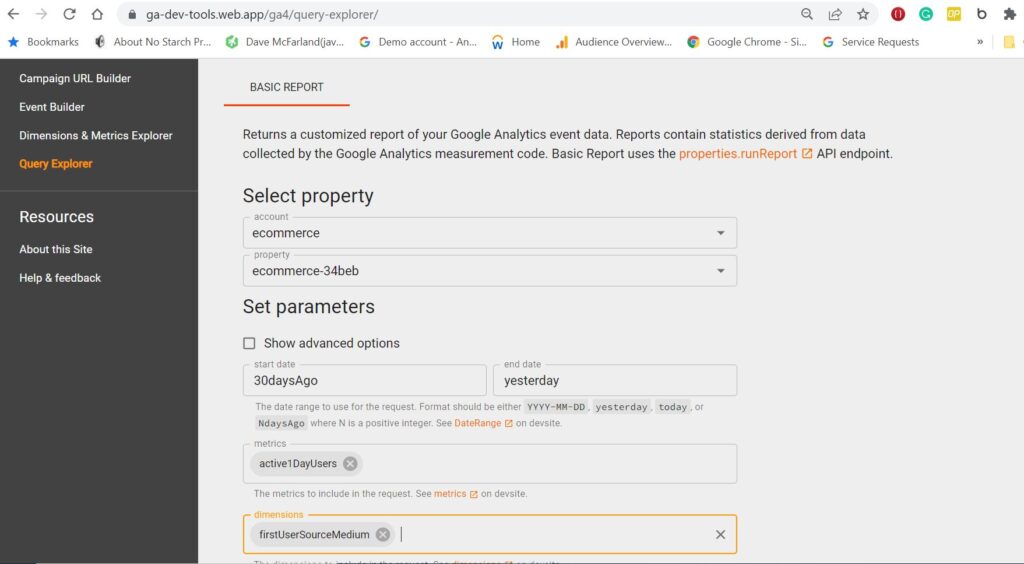
Query Explorer — reponse
Query Explorer – advanced options
You have many more options when fine-tuning your query (below).
Two more notes:
- (Obviously), you can only use the GA4 Query Explorer on GA4 peroperty you have access to.
- This API GA4 Dimensions & Metrics overview is very handy to bookmark as well.
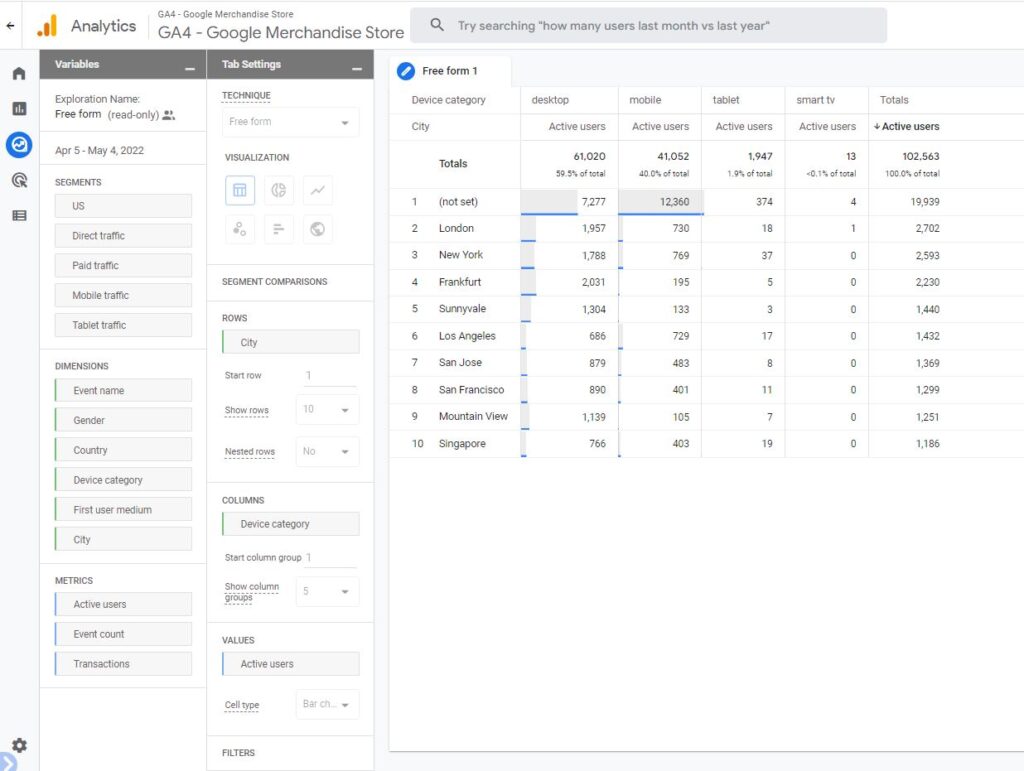
Point 4: Leverage them in Comparisons
In the previous post, I wrote about Comparision in GA4. Read this post to learn all details.
Within the default reports, you can build “segments” (named comparisons) based on dimension values.
Here is an example of how it works.
Step 1: Click add Comparison in the default report
Step 2: After creating comparison click apply(bottom right)

Step 3 Last: You can easily visualize the newly created report comparing all users with the country India
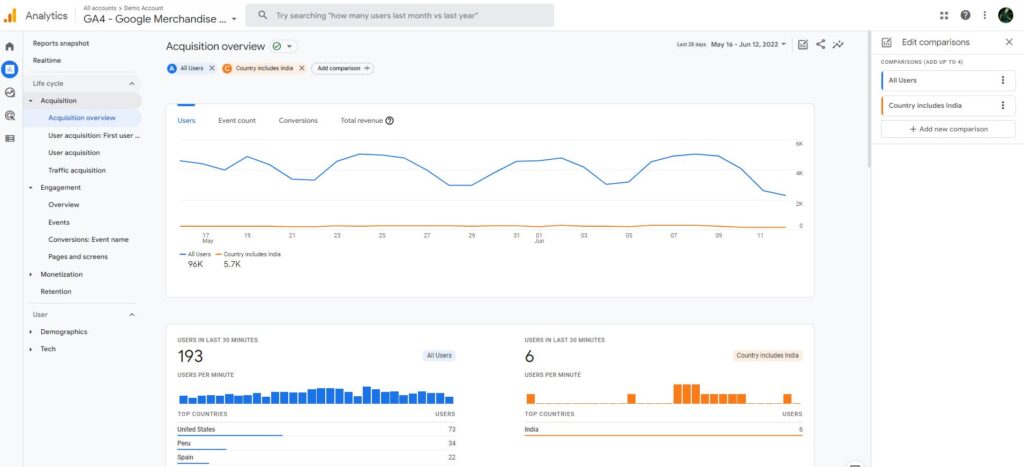
The focus is on the “Total revenue” metric with the “Country” dimension (value = India).
It’s clear that on this store considerable revenue comes from the India about 10%.
Tip: you can review all default reports with this extra layer applied. Unfortunately, you need to recreate these comparisons when you end your session and come back at a later time.
Point 5: Build Powerful Segments
GA4 greatly empowers you with additional options in the “Explore” section.
This is where you can create segments for an in-depth analysis.
Currently, you can create segments based on event names, dozens of dimensions, and a handful of predictive metrics. The user-scoped predictive metrics are only available in user-level segments.

Point 6: Build Powerful Audiences
On of the best way to use dimensions and metrics in GA4 is by building Audiences.
On the top right you will see a blue button “New Audience”. The screen below appears after you click on that button.
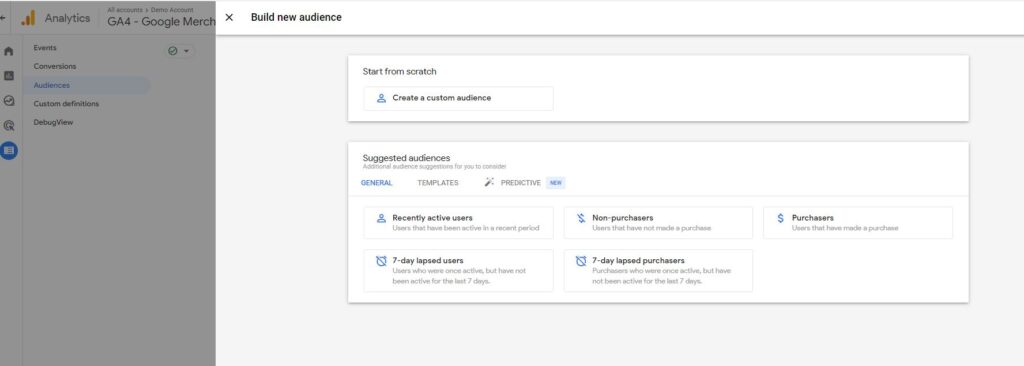
You can either use a suggested audience (with predefined metrics and dimensions) or create one yourself.
Let’s have a look at custom audiences.
In terms of available metrics and dimensions, it’s very similar to user-level segments.
You have an additional option to create an audience based on LTV which can be very powerful.
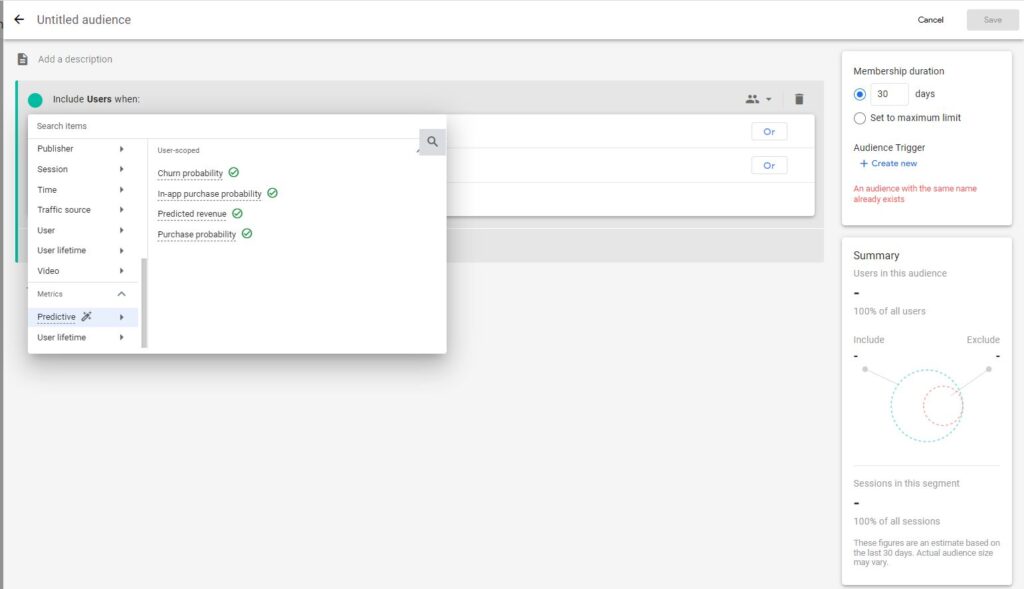
Your audiences are available in your shared library in Google Ads if you link your GA4 property to Google Ads and keep the default option to Enable Personalized Advertising.
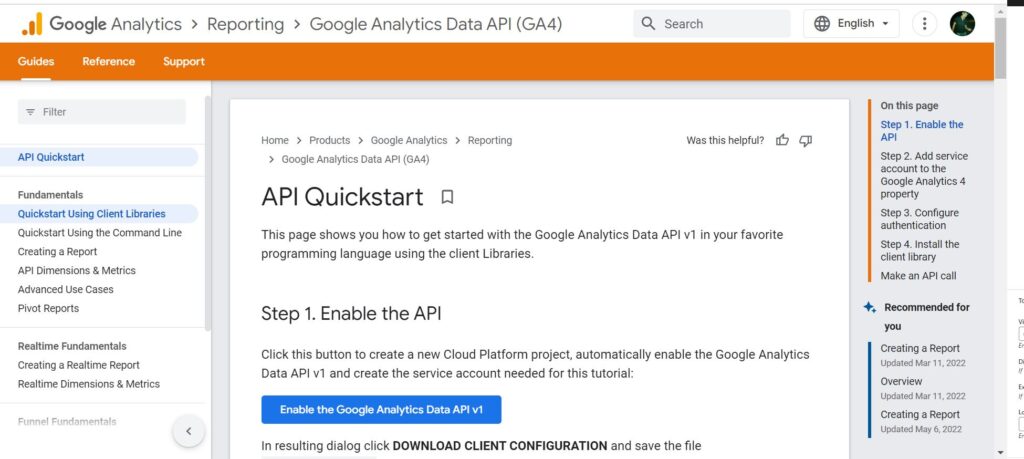
Tip 7: Export Them via the Data API
I have already mentioned the Google Analytics 4 Data API schema.
It’s very useful to bookmark this page and keep it as a resource for when you need to know which metrics and dimensions you can exactly query (this might change over time).
In addition, for advanced users and Dev enthusiasts, here is the GA4 API Quickstart guide.
Point 8: Set up Custom Dimensions and Metrics
GA4 is very different compared to GA3/Universal Analytics when it comes to Event Tracking. Every hit is an “event” and you can add multiple parameters to provide context to each of your events.
In GA4 most parameters are not available on default and you need to register them as custom definitions (custom dimensions and metrics).
That’s why I recommend mapping out all the events that you want to track including the corresponding parameters. Also, register those (that are not available on default) in the GA4 interface.
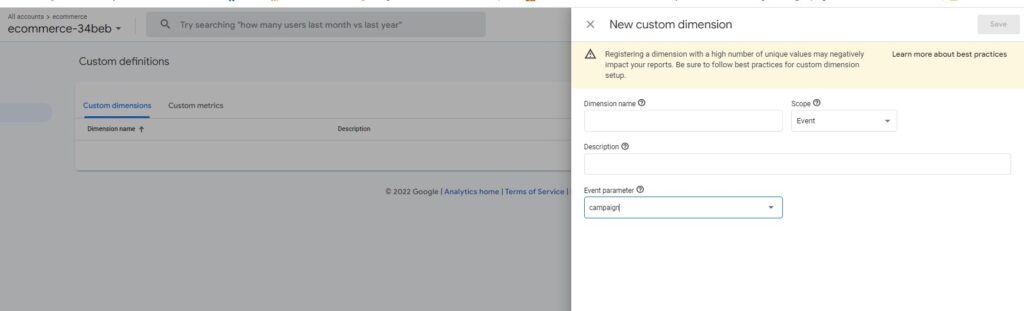
Step 1: Go to “Custom definitions” tab in the GA4 interface.
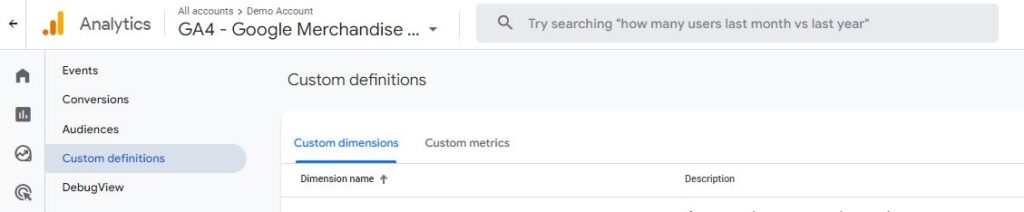
Step 2: Create new custom dimensions and metrics.
Read this support article if you need more information on the creation process and limits.
After +/- 24 hours they will become available in the “Explore” section. You can then use them to build custom reports and analyze your data.
Also, you can leverage user-scoped custom dimensions in segments and audiences.
Point 9: BigQuery Power to Analytics
The native, free integration between BigQuery & GA4 is really powerful.
In terms of GA4 dimensions and metrics, it allows you to query an unlimited number of both. (working knowledge of SQL is required)
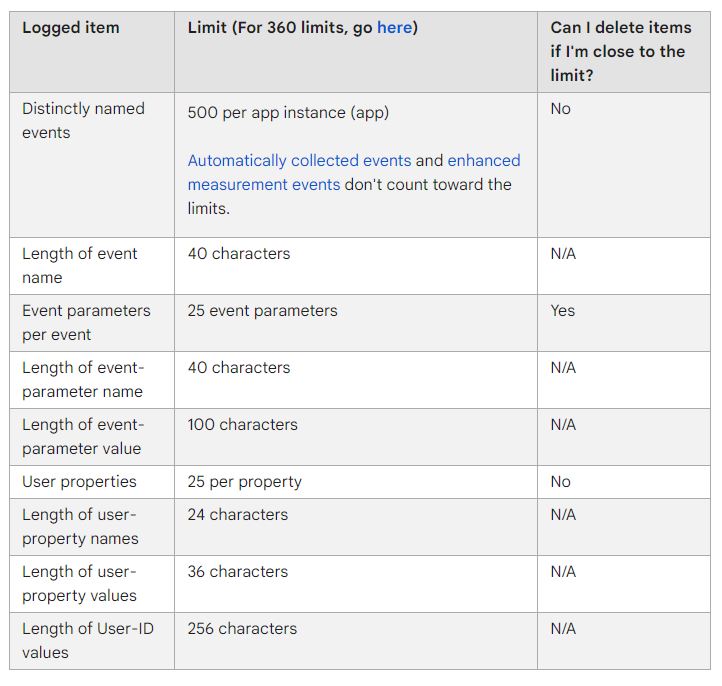
The GA4 interface comes with limits on how many parameters you can register as a custom metric or dimension.
Configuration Limits
The BigQuery integration will be a great help if you are serious about data analysis. You can run segmented, powerful queries literally in seconds!
Also, it’s very helpful in case you forgot to create custom dimensions or metrics for some of the parameters. They are all waiting for you in BigQuery even if they aren’t registered in GA4.