
The segment overlap technique lets you compare up to 3 user segments to quickly see how those segments overlap and relate to each other. This can help you isolate specific audiences based on complex conditions. An analysis technique that visualizes the relationship between multiple segments of users is known as a segment overlap report.
New segments can be created based on what kind of business you are running and what findings you have after tracking. This report helps you understand specific audiences by isolating them based on complex or advanced segments.
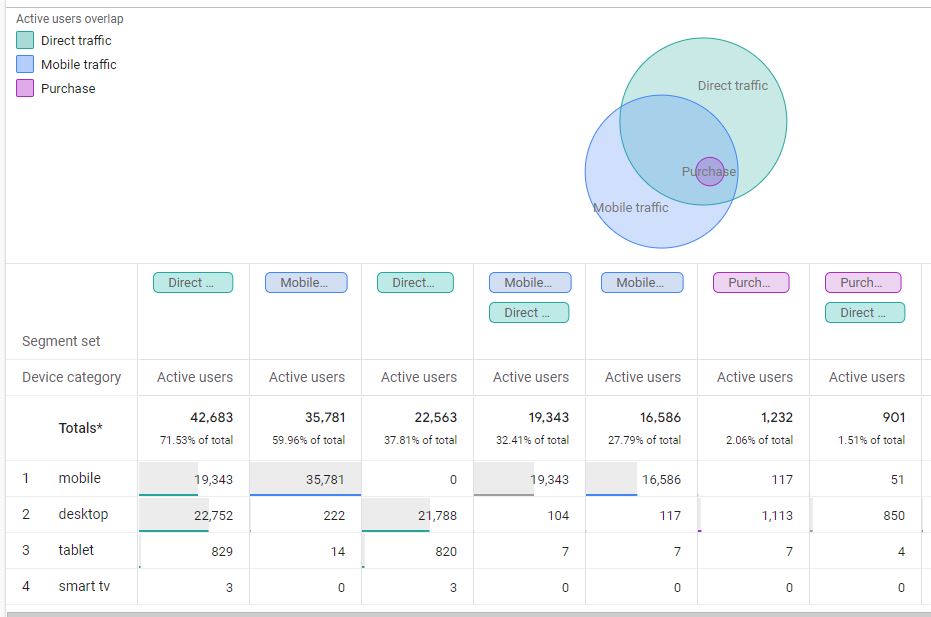
A sample segment overlap report looks like below
The capability of segment overlap report in GA4:
- Only 3 segments can be added to compare
- You can break down your report using another dimension, such as country, age group, gender, etc.
- Can create a new segment or audience using the overlap or intersection users and then use this audience across Google Platforms like Google Ads, Display ads, etc.
Components Available
After logging in to your GA4 account on the left sidebar you can see the Segment Overlap. If you choose that you will see a sample data report from your account with some configuration. If click on blank then you have to start everything from scratch.
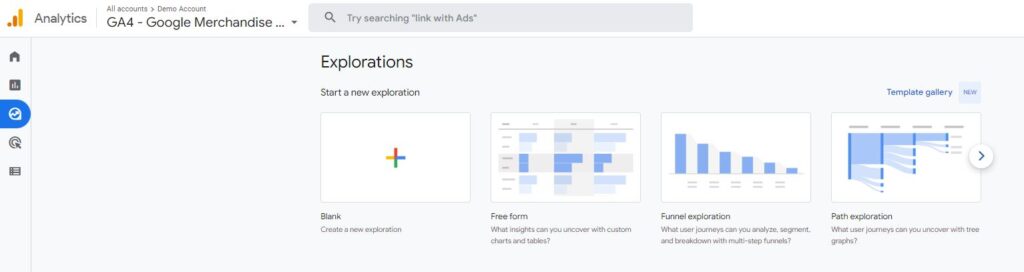
As you click on the Free form report you can see 3 sections available.
- Variables
- Tab settings (Tools)
- Output (reports generated based on tools selected in the tab)

Variables
The variable is basically data points available in your analytics tracking whether it is dimensions, metrics, user property, or events property. It is the place where you decide on what data points you want to do analysis. It can be date range, segments, Dimensions, Metrics
You can change the name & Date range of your analysis report from the top-left interface.
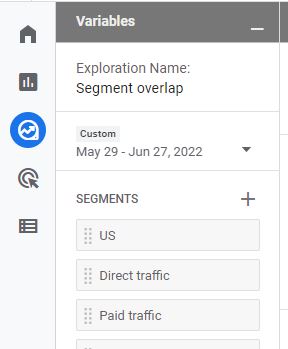
Segments
If the analysis is needed to be done on different types of visitors like logged in, guest, or anonymous, You have to include those segments. You can choose from several segments that are already included or if you have any custom segments created.
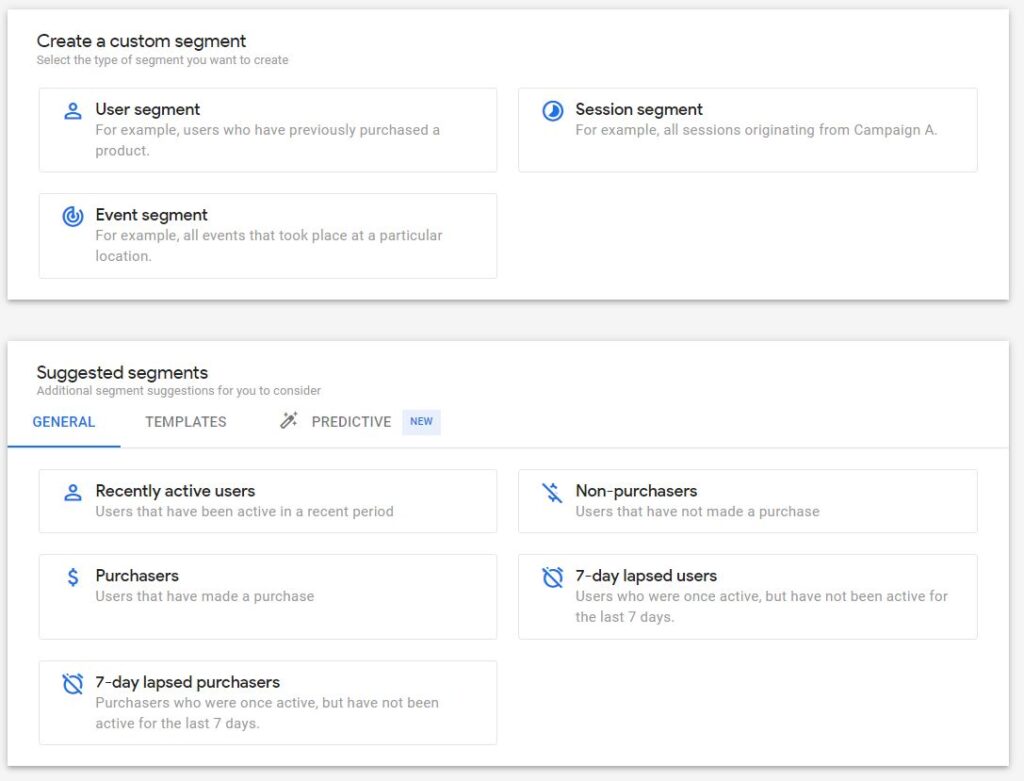
3 kinds of segmentation attributes are available
- User Segment: Here you can match user data based on certain criteria
- Session Segment: Here you can include sessions matched data points of the Audience
- Event Segment: Here you can only include event-based data points
Dimensions and metrics
Dimensions in Google Analytics are basically attributes/ parameters of an event, product, transaction, user, etc.
- Event Name
- Category
- User properties
- Event properties
Metrics help to measure the numeric values against dimensions like how many events were captured yesterday, campaign count, click count, and campaign conversion value.
- Number of events
- Active user count
- Total transactions
- Campaign click
Tab Settings
In this column section, you can configure what the report will look like. There is a technique drop-down from there you can select the report type it can be Free form, funnel Exploration, or Path exploration. I am doing this analysis in the Google Analytics Demo account.
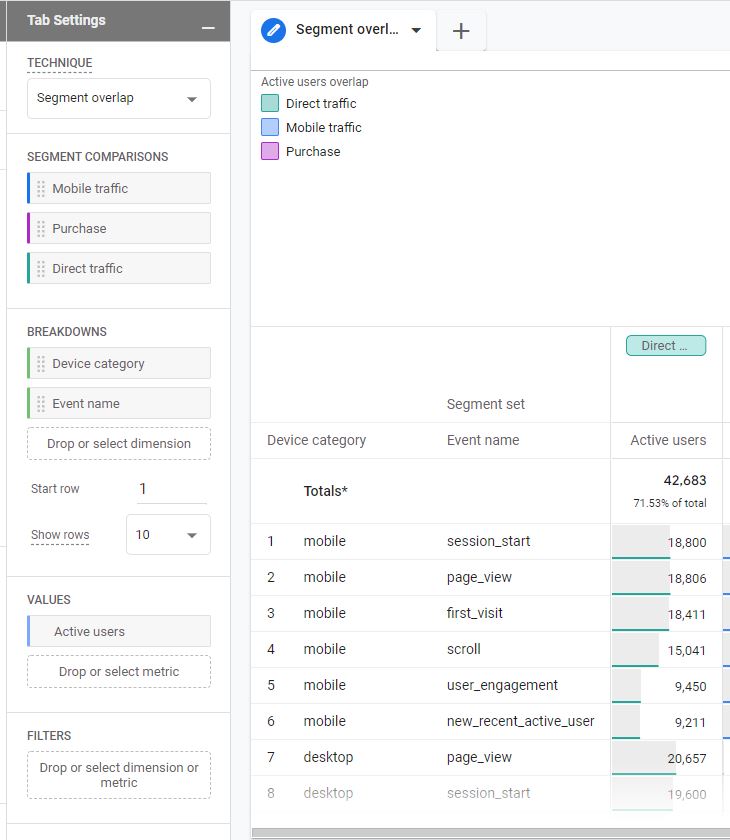
Segment
In this Tab, you can add segments you want to analyze only up to 3. Three segments can be compared in the analysis.
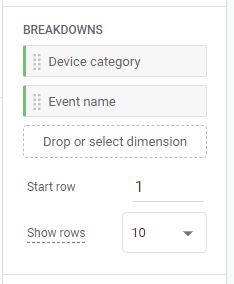
Breakdown
In segment overlap analysis, you can further break down reports based on the dimensions selected. I have selected the Device Category to see if segments overlap b/w devices.
If the dimension cardinality is huge then there will be several possible values you can select the number for rows per dimension to display.
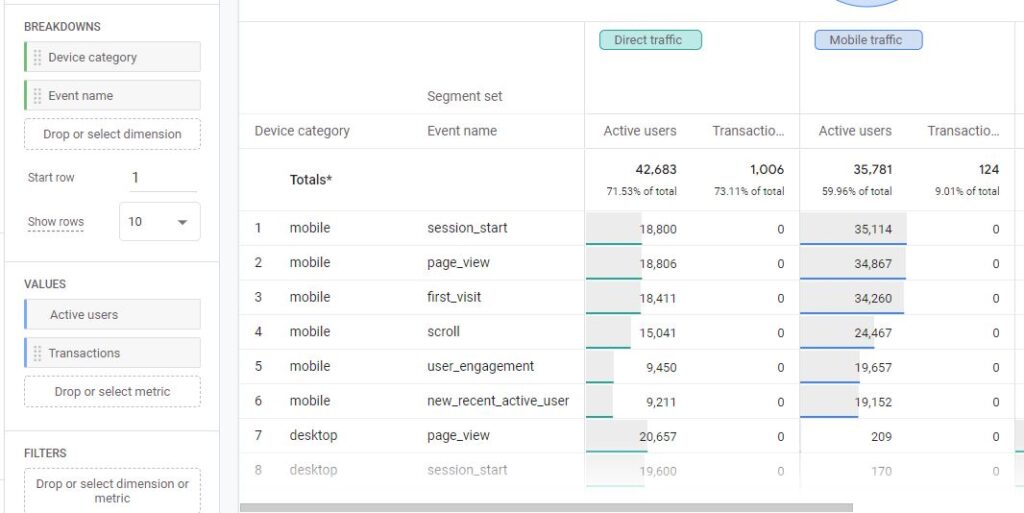
Values
If you wanted to see values related to certain metrics then you can select metrics and drop them in the value tab. It shows the number involved related to segment overlap.
I have selected Active users & transactions as values, for them, we can see values in the analysis report.
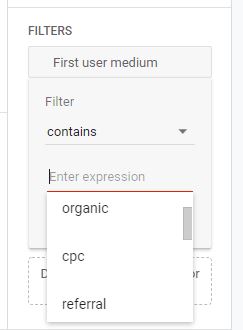
Filters
If you don’t want to see any data like (not set) you can apply filters to restrict the data shown in the analysis according to the conditions configured.
If your filter has multiple conditions, all conditions must be met to apply the filter.
Reporting
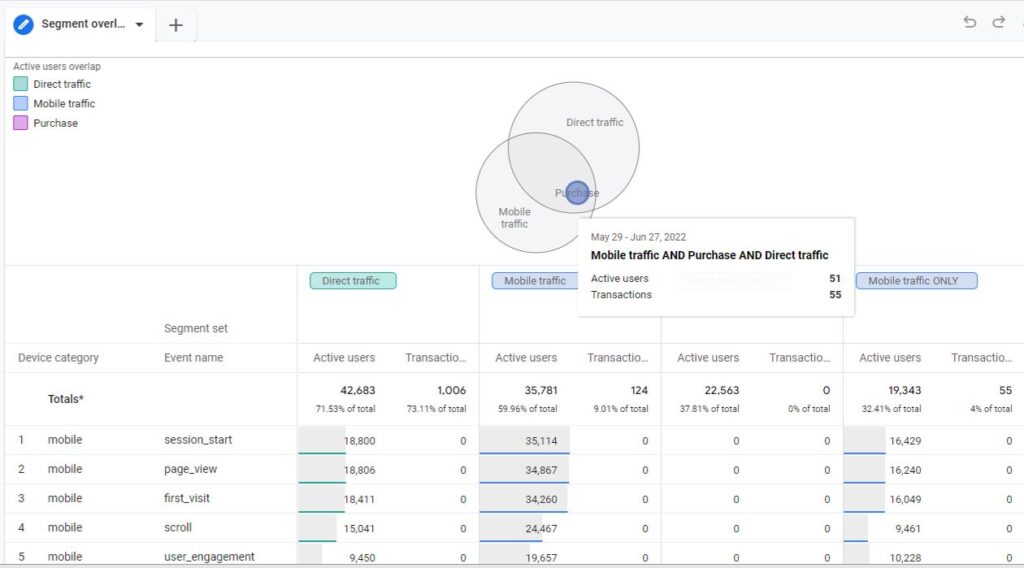
The segment overlap diagram is interactive. If you hover your mouse on to segment or union or intersection of two or more segments you can see numbers for that intersection.
As you can see in the Image the intersection highlighted is a combination of all three segments. A total of 55 transactions from Direct mobile traffic and 5 active users on mobile.
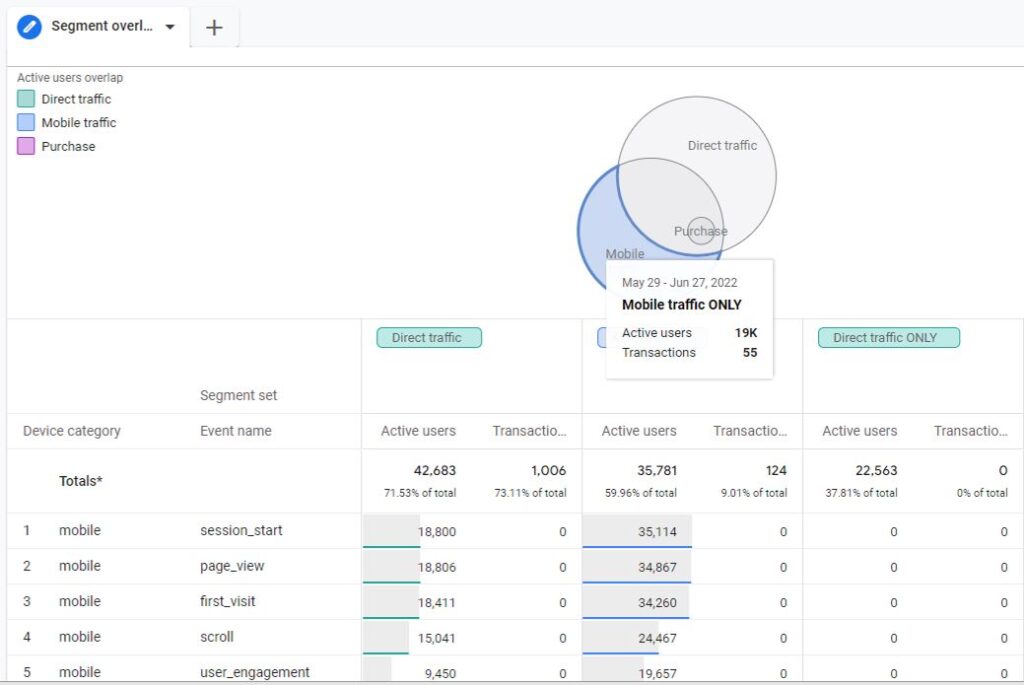
You can also move your pointer to the border of segments to see inclusive numbers for that segment: this even includes any overlap with other segments. The below image highlighted active users with transactions and direct traffic excluded.
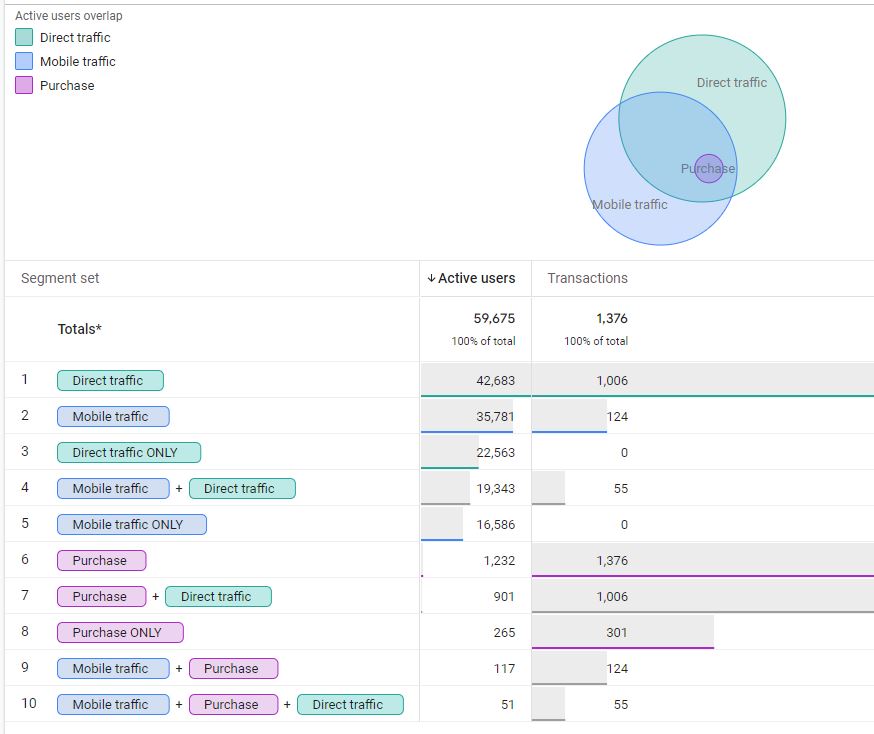
You can also see the correlation between these overlapped segments in the table created but you have to remove the breakdown.
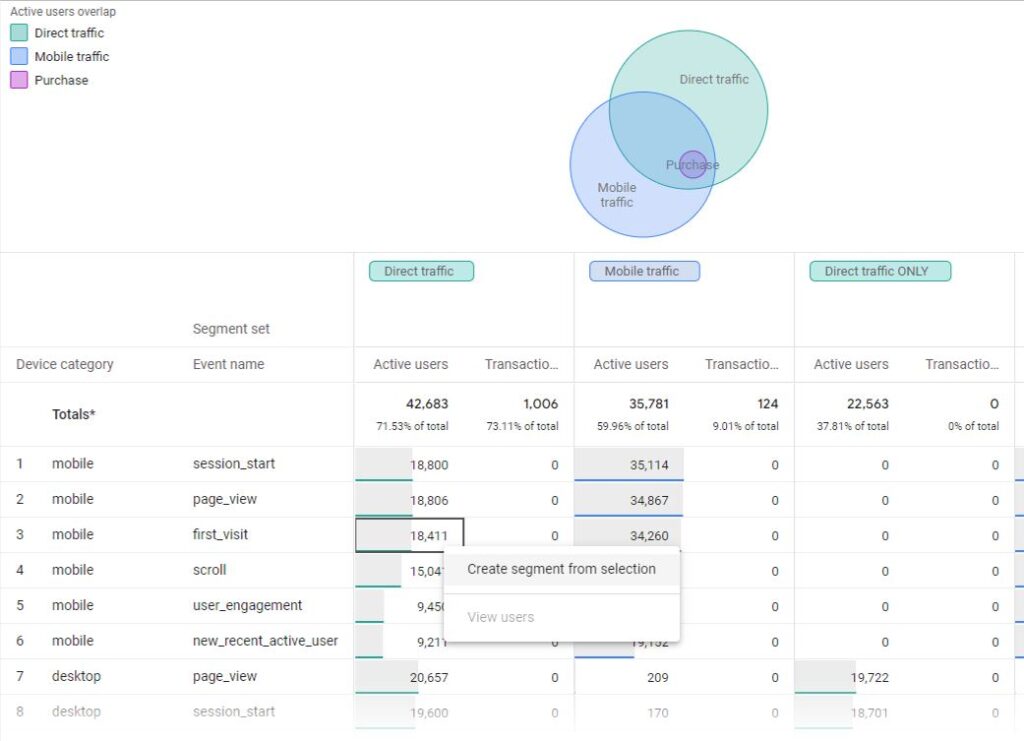
You can also creat custom segments from data visible and save it for further use in campaigns

Pingback: Easy Funnel Exploration Reports in Google Analytics 4 - Analytics Smart