Cohort Analysis is a form of behavioral analytics that takes data and group it into related groups rather than looking at the data as one unit. These groupings are referred to as cohorts. They actually have similar characteristics such as time and size.
Cohort analysis helps you understand the behavior of component groups of users apart from your user population as a whole.
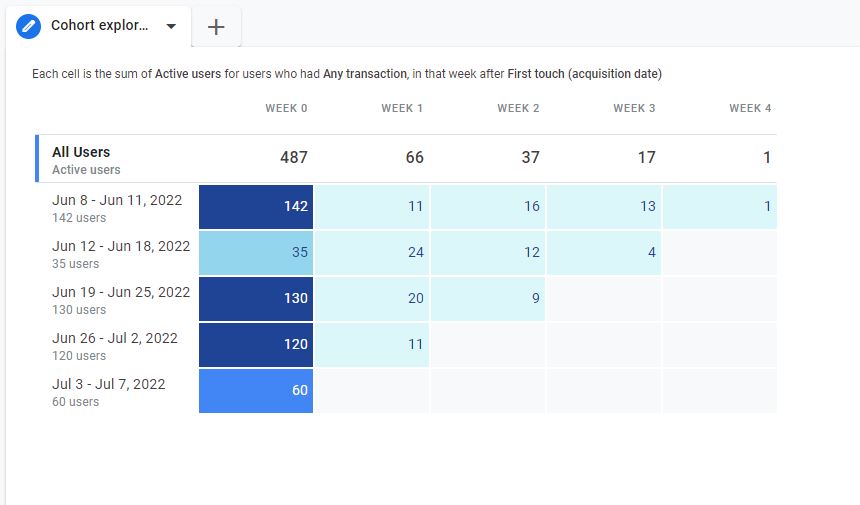
Table of Contents
Two Types of cohort analysis
There are two types of cohort studies: prospective and retrospective (historical) cohorts. Prospective studies provide a cohort into the future for a health outcome, while retrospective studies trace the cohort back in time for exposure information after the outcome has occurred.
Why Cohorts are important?
Cohort analysis provides a better understanding of user trends and behavior of cohorts that affect business metrics like acquisitions and retention. A better understanding of user trends and behaviors allows you to take steps to encourage other users to follow the same behaviors you identified in other cohorts.
Components Available
After logging in to your GA4 account on the left sidebar you can see the Reports tab and by clicking on that you can see the Cohort report block. If you choose that you will see a sample data report from your account with some configuration. If click on blank then you have to start everything from scratch.
As you click on the Free form report you can see 3 sections available.
- Variables
- Tab settings (Tools)
- Output (reports generated based on tools selected in the tab)
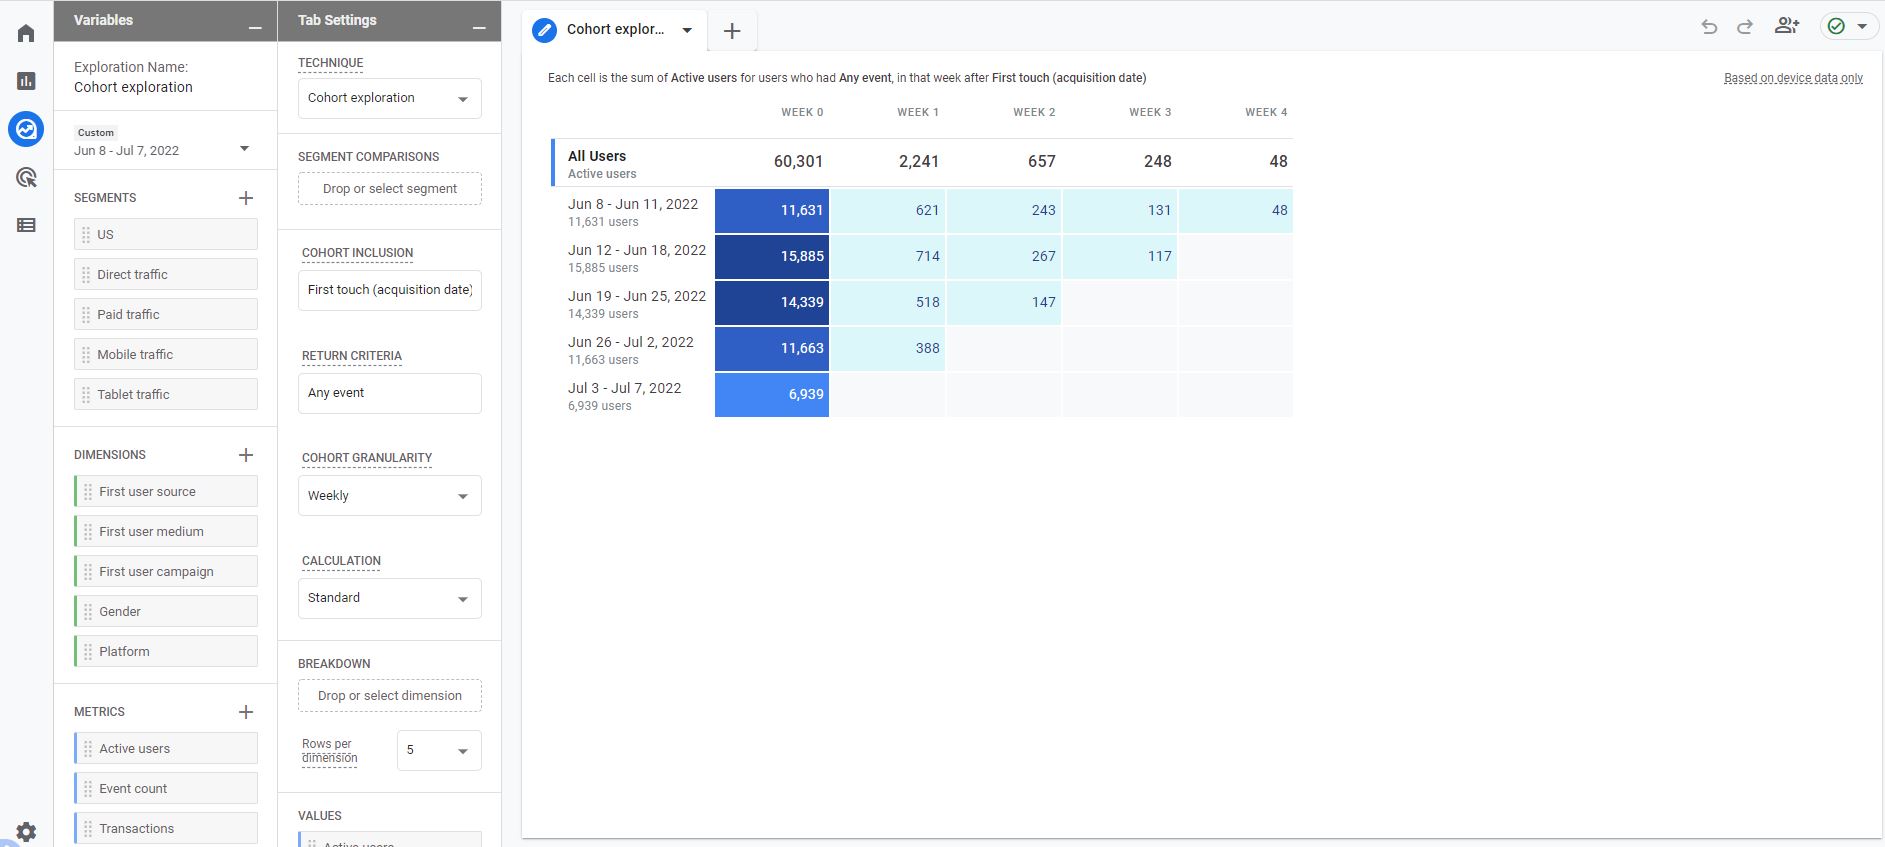
Variables
The variable is basically data points available in your analytics tracking whether it is dimensions, metrics, user property, or events property. It is the place where you decide on what data points you want to do analysis. It can be date range, segments, Dimensions, Metrics
You can change the name & Date range of your analysis report from the top-left interface.
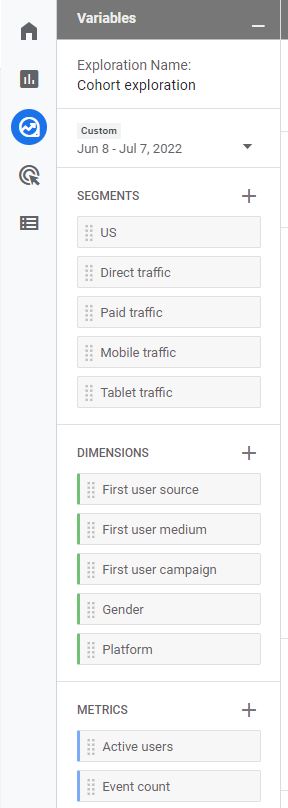
Segments
If the analysis is needed to be done on different types of visitors like logged in, guest, or anonymous, You have to include those segments. You can choose from several segments that are already included or if you have any custom segments created.
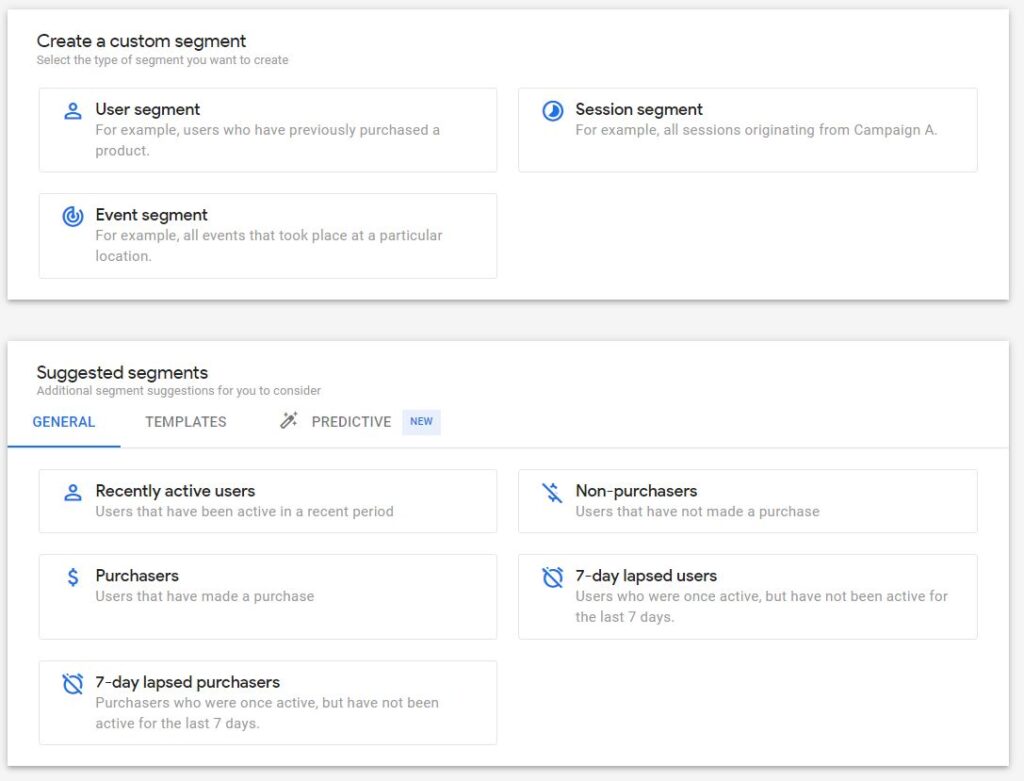
3 kinds of segmentation attributes are available
- User Segment: Here you can match user data based on certain criteria
- Session Segment: Here you can include sessions matched data points of the Audience
- Event Segment: Here you can only include event-based data points
Dimensions and metrics
Dimensions in Google Analytics are basically attributes/ parameters of an event, product, transaction, user, etc.
- Event Name
- Category
- User properties
- Event properties
Metrics help to measure the numeric values against dimensions like how many events were captured yesterday, campaign count, click count, and campaign conversion value.
- Number of events
- Active user count
- Total transactions
- Campaign click
Tab Settings
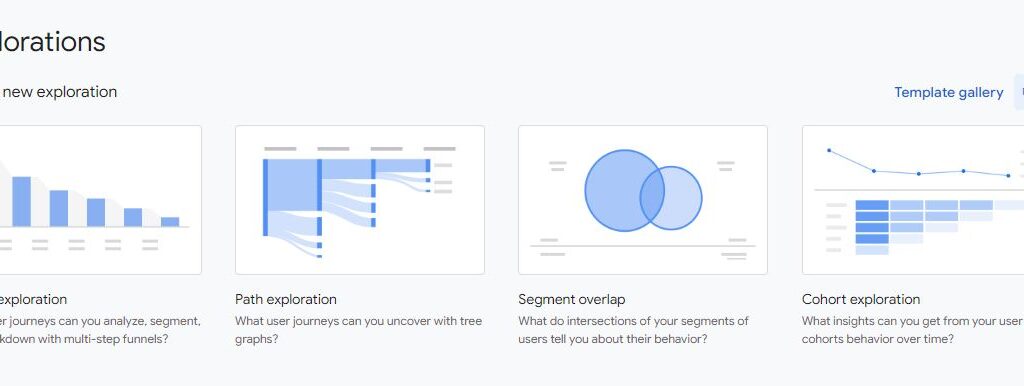
In this column section, you can configure what the report will look like. There is a technique drop-down from there you can select the report type it can be Free form, funnel Exploration, or Path exploration. I am doing this analysis in the Google Analytics Demo account.

Segment
In this Tab, you can add segments you want to analyze for cohort analysis groupings. Here you can do segment comparisons for research
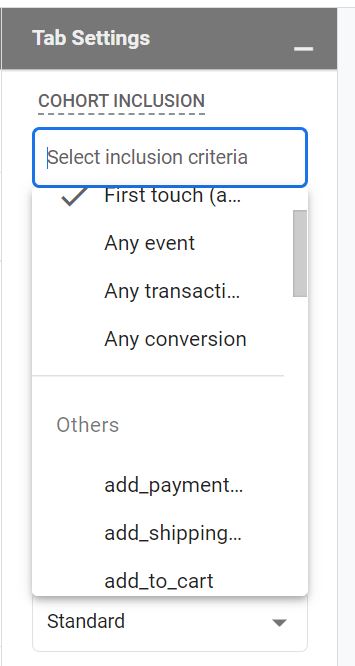
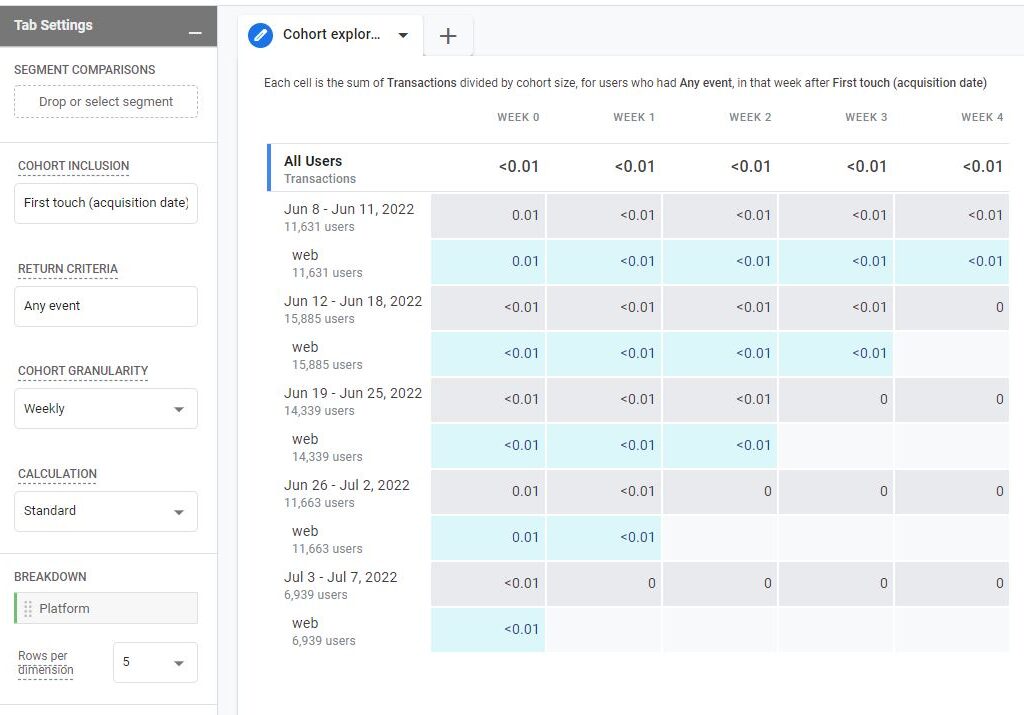
Cohort Inclusion
There are some predefined events available and then there are selection criteria for any other events whichever is suitable for your use cases and analysis. All the events configured are available over here.
- First touch (acquisition date): when the first time user visited the app or website
- Any event: the first event of visitor in the selected date range.
- Any transaction: First transaction in the selected date range.
- Any Conversion: First conversion event in the selected date range.
- others: any other specific event triggered by a visitor.
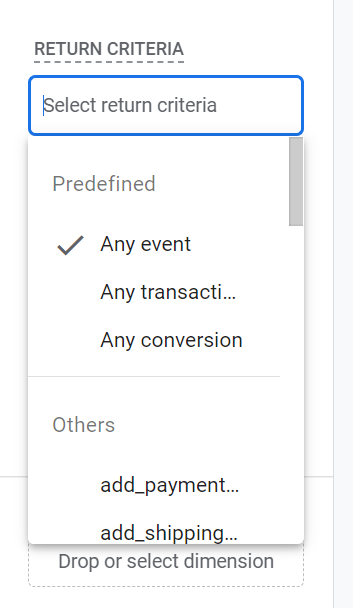
Return Criteria
By definition, Any event: the user has at least 1 event within the exploration time period, and Any conversion: the user has at least 1 conversion event within the exploration time period. Others: a specific event triggered by the user within the exploration time period.
Cohort Granularity
- Daily
- Weekly
- Monthly
Calculations
- Standard: Each cell includes all cohort users who meet the return criteria for that individual period, regardless of what they do in other periods. The metric displays the total value for that individual period.
- Rolling: Each cell includes all cohort users who meet the return criteria for that period as well as all previous periods. The metric displays the total value for that individual period.
- Cumulative: Each cell includes all cohort users who meet the return criteria in any period in the exploration. The metric displays the cumulative total value for each period.
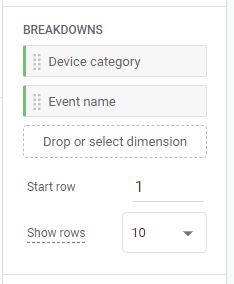
Breakdown
In segment overlap analysis, you can further break down reports based on the dimensions selected. I have selected the Device Category to see if segments overlap b/w devices.
If the dimension cardinality is huge then there will be several possible values you can select the number for rows per dimension to display.
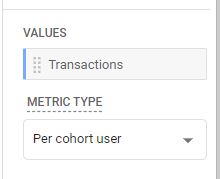
Values
If you wanted to see values related to certain metrics then you can select metrics and drop them in the value tab. It shows the number involved related to segment overlap.
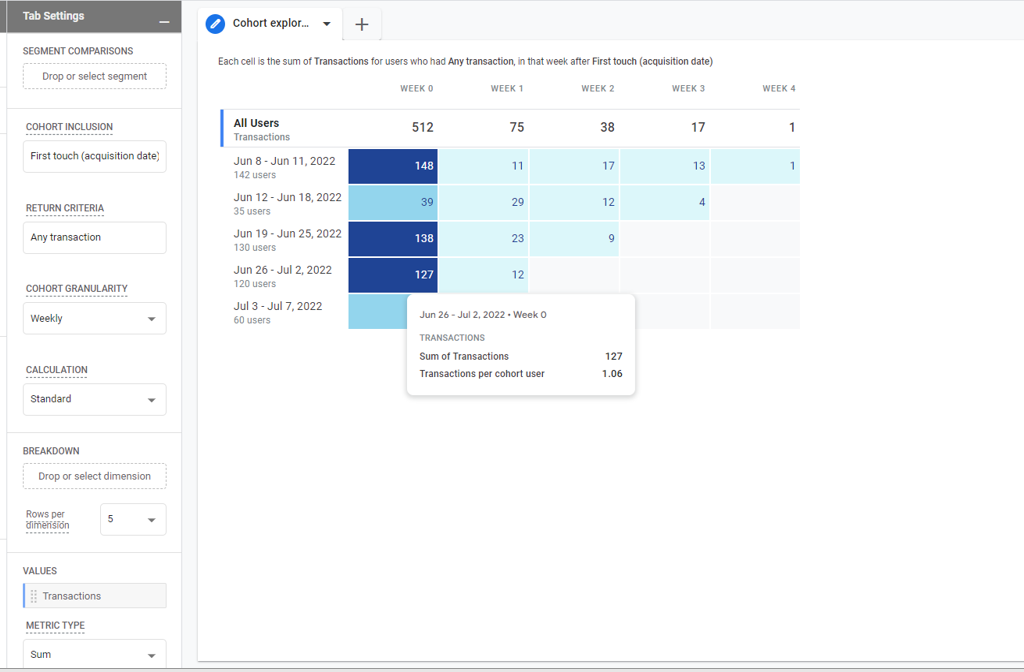
I have selected Active users & transactions as values, for them, we can see values in the analysis report.
Metrics Type
- Sum: shows the total sum of users in the cohort
- Per Cohort User: Avg out for single user in the cohort.
Limits of cohort exploration
- Cohort exploration can show a maximum of 60 cohorts.
- When you apply a breakdown dimension, a maximum of the top 15 values of that dimension are shown.
- Demographic dimensions are subject to thresholding. If the number of users in the cohort is too small to protect their anonymity, those users won’t be included in the exploration.
Reporting
Each cell is the sum of Transactions for users who had Any transaction, in that week after First touch (acquisition date)