
Reporting in Google Analytics 4 is completely different compared to Universal Analytics for what we are used to. Now GA4 is a more analytical tool for reports you have to make connections to Data studio dashboards. Free form reporting is an exploration report
Explore tab is very powerful for Analysis and understanding of Data in all of the segments created. This is the place where you can do ad-hoc analysis and dig deeper into your data.
Exploration reports in Google Analytics 4
Table of Contents
Components Available
After logging in to your GA4 account on the left sidebar you can see the Free form. If you choose that you will see a sample data report from your account with some configuration. If click on blank then you have to start everything from scratch.
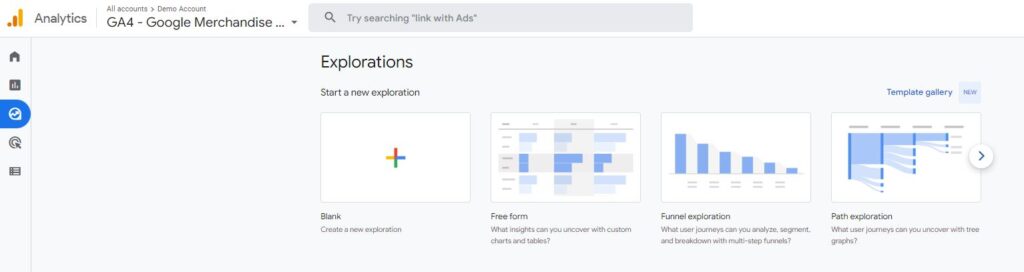
As you click on the Free form report you can see 3 sections available.
- Variables
- Tab settings (Tools)
- Output (reports generated based on tools selected in the tab)
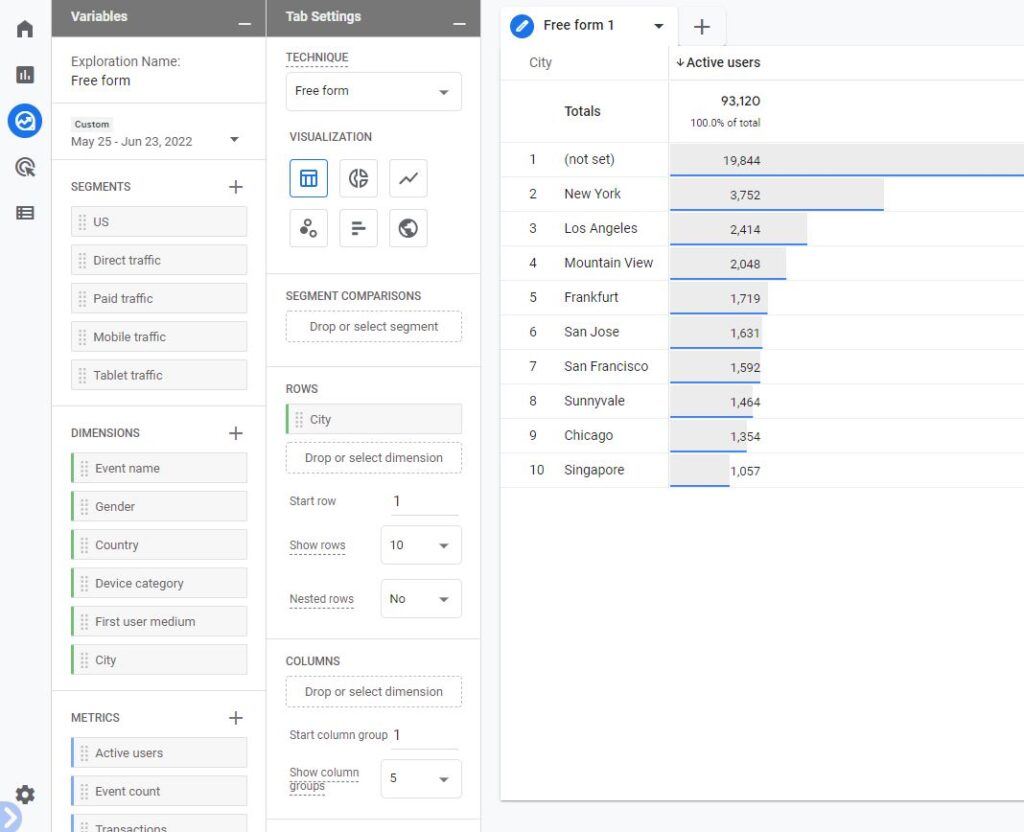
Variables
The variable is basically data points available in your analytics tracking whether it is dimensions, metrics, user property, or events property. It is the place where you decide on what data points you want to do analysis. It can be date range, segments, Dimensions, Metrics
You can change the name & Date range of your analysis report from the top-left interface.

Segments
If the analysis is needed to be done on different types of visitors like logged in, guest, or anonymous, You have to include those segments. You can choose from several segments that are already included or if you have any custom segments created.
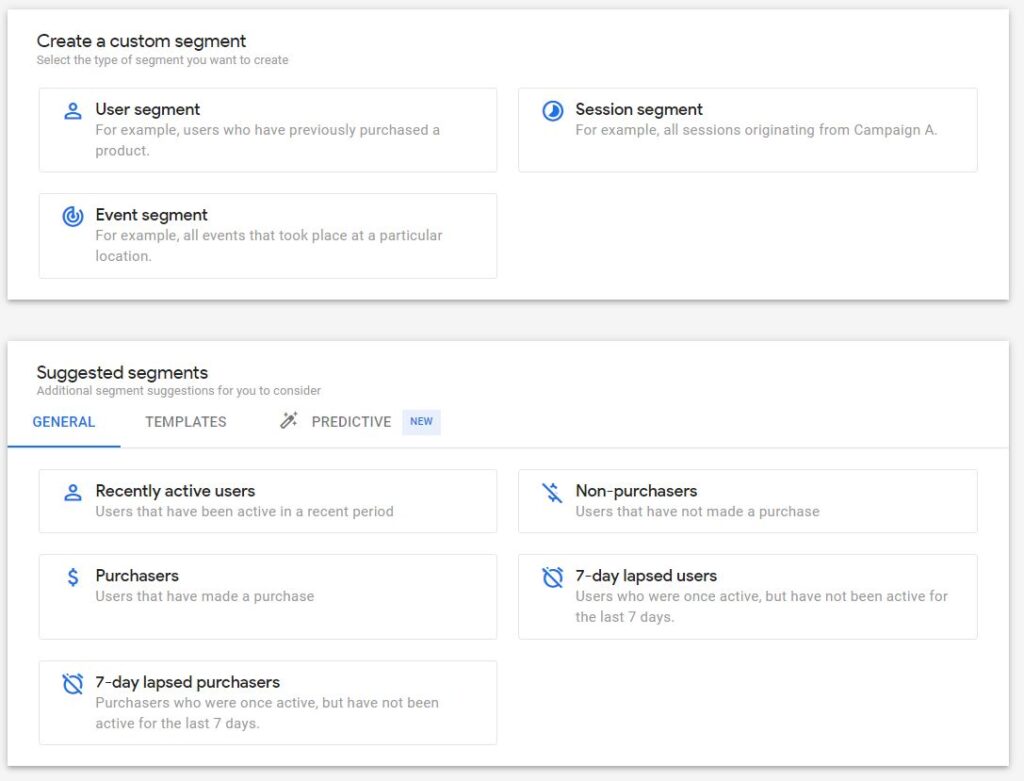
3 kinds of segmentation attributes are available
- User Segment: Here you can match user data based on certain criteria
- Session Segment: Here you can include sessions matched data points of the Audience
- Event Segment: Here you can only include event-based data points
Dimensions and metrics
Dimensions in Google Analytics are basically attributes/ parameters of an event, product, transaction, user, etc.
- Event Name
- Category
- User properties
- Event properties
Metrics help to measure the numeric values against dimensions like how many events were captured yesterday, campaign count, click count, and campaign conversion value.
- Number of events
- Active user count
- Total transactions
- Campaign click
Tab Settings
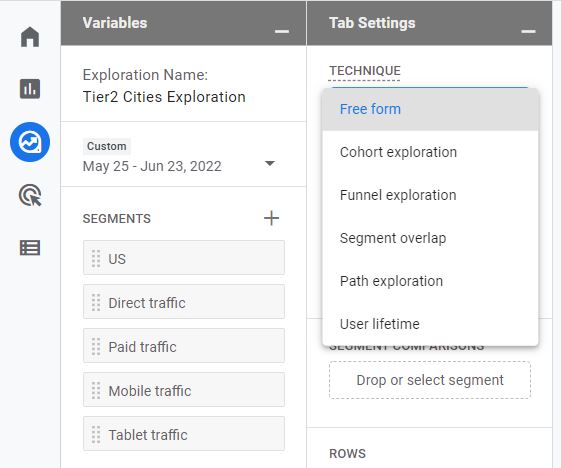
In this column section, you can configure what the report will look like. There is a technique drop-down from there you can select the report type it can be Free form, funnel Exploration, or Path exploration.
After that, there is a visualization section to select from.
- Table
- Donut chart
- Line chart
- Scatterplot
- Bar chart
- Geo map
Each visualization is different and affects the customization options available in the column. For a discussion as of now, I will be sharing tables. As data visualization is a whole different chapter.
Segment comparison
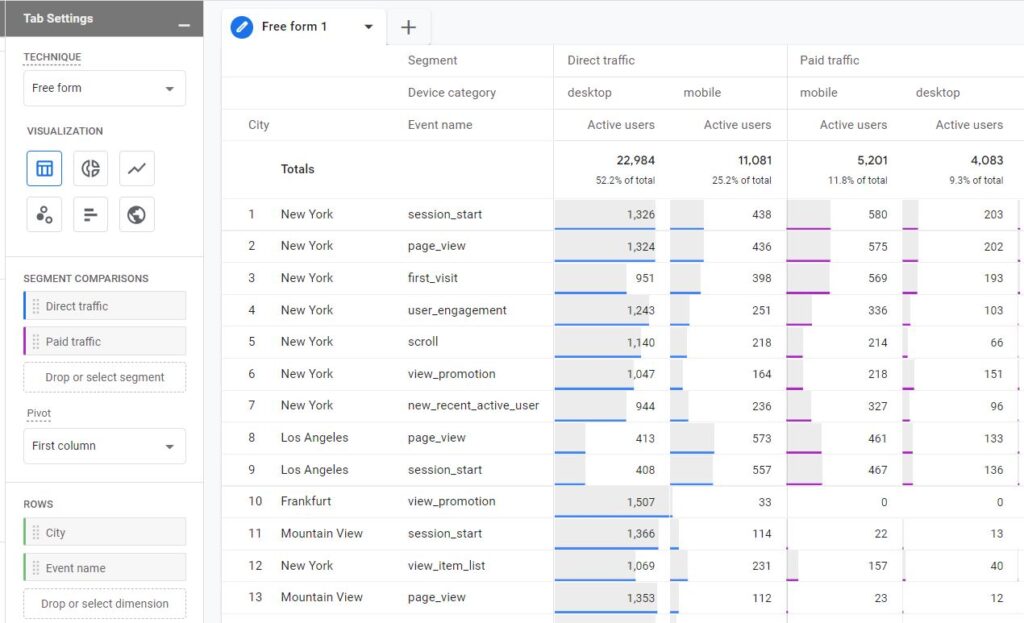
In segment comparison sections available, someone can include at most 4 segments that should already be included in the segments section of the Variables Tab.
You can either choose double click on the segment in the variable tab to add it to tab settings automatically or just drag and drop. If you have one segment added for comparison a new Pivot field will appear. This field si responsible for the placement of segments in the table. There are 4 options in this: first row, last row, first column, and last column.
Example Report:
- I have selected 2 segments paid and direct visitor
- Event name dimension in row
- Device category dimension in column
- Active users is the metric
Pivot: First Column –> A segment is visible in 1st row in each column
Pivot: Last Column –> The segment name is visible below in all dimensions in each column

Pivot: First row –> The segment-first on every row.
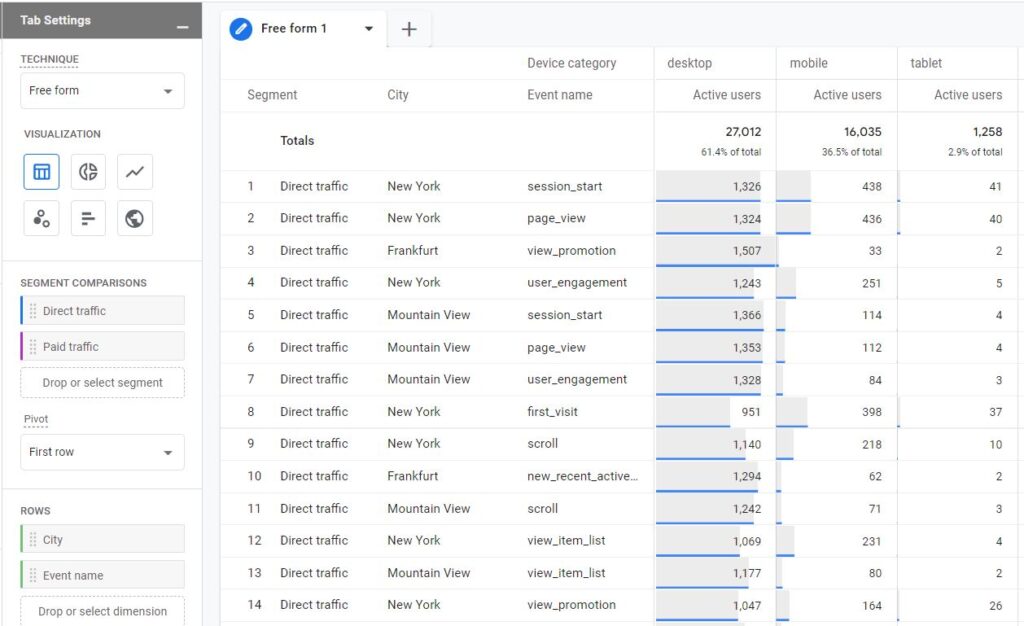
Pivot: Last row –> Segment comes last after

Rows
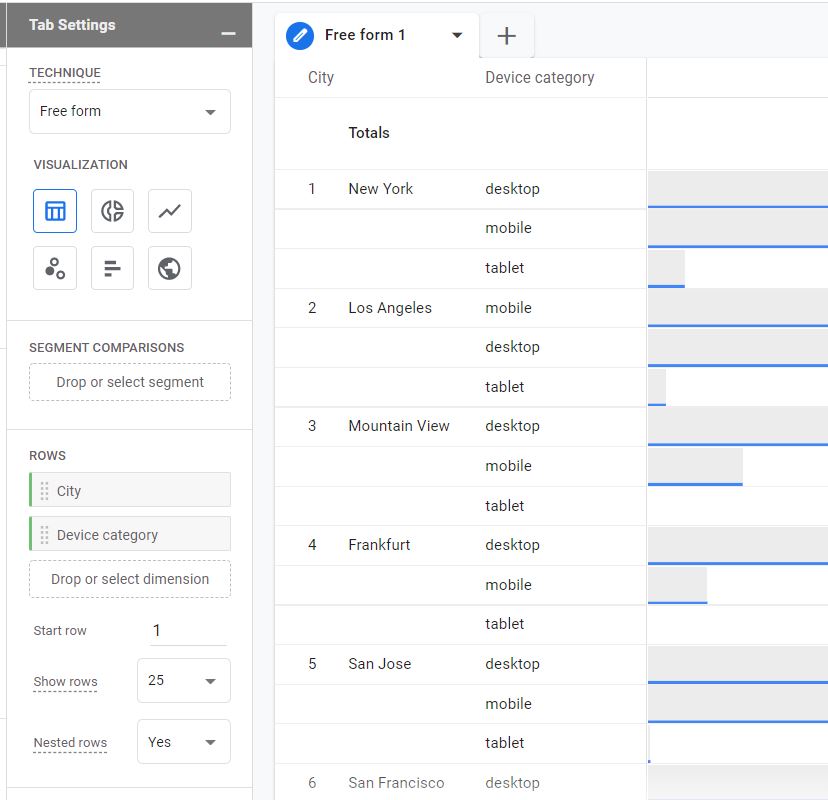
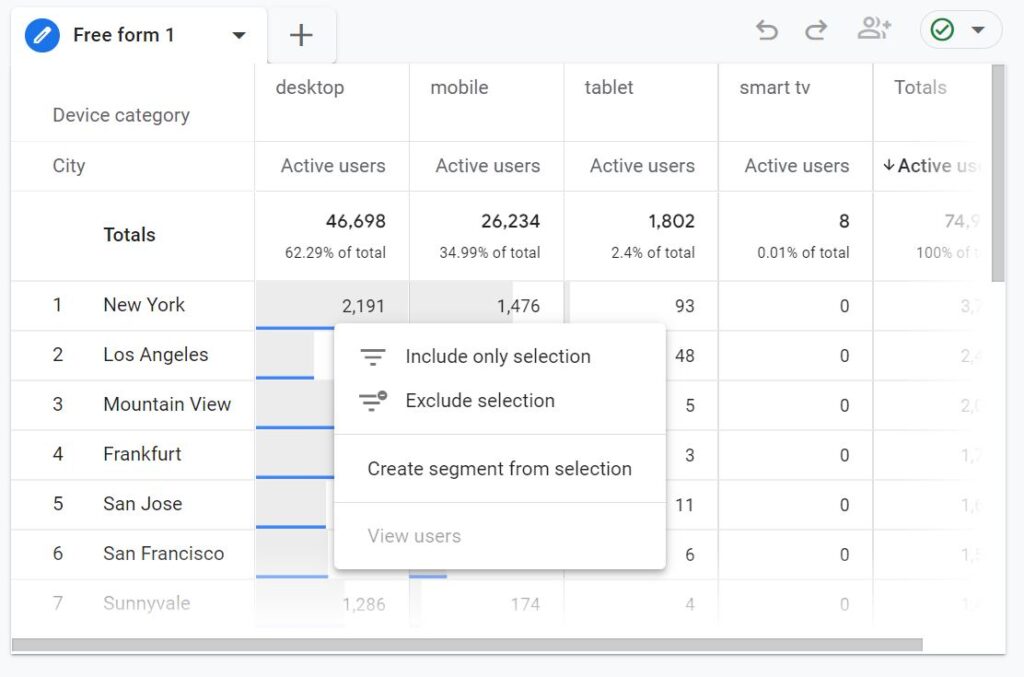
here you have to decide what dimensions you want to use in the rows of the table. In the below analysis I have used city and event names.
If it is required you can include multiple dimensions as rows. Then different combinations of all dimensions will be displayed as a separate row.
In above report example with two dimensions, city and event names. Both dimensions were displayed within the same row. If I switch to nested rows, visualization will change.
Columns
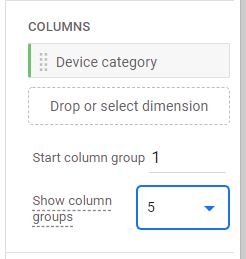
After rows, you can also add dimensions as columns. I have changed the device category from rows to column section on left. changes are shown below

You can see each device category now has its own column. Even can also choose which column you want to display data.
And, you can select the maximum number of columns per single dimension. If the dimension has a cardinality of 10 unique values but you only set it to show column groups to 5, only the first five dimensions will be displayed
Values
In values, you can drag metrics that you want to display as columns in the report. The maximum number of metrics added to the values section of a single report is 10.
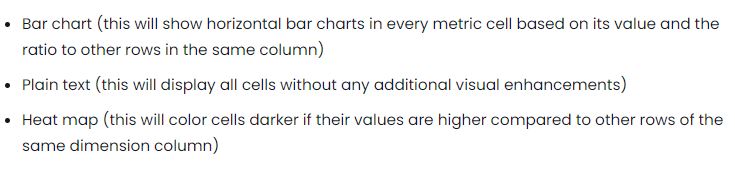
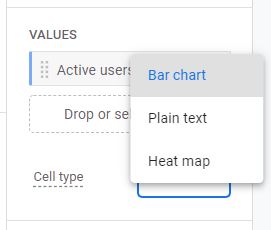
You can select a specific cell type:
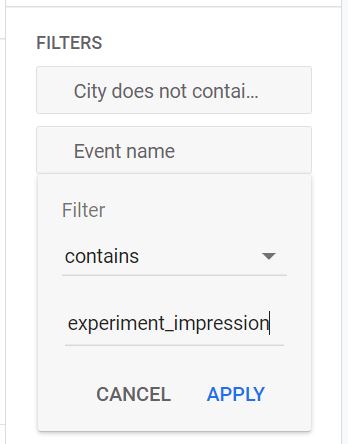
Filters
I want to narrow it down to specific data points then you can use these filters. There are cases when someone might want to include or exclude something from the report

Consider you want to create an event report and wanted to exclude or include some specific event types. I have excluded experiment_impression from event reports
Report Output
Once you configure all the necessary things after selecting variables and configuring tab columns, the report will appear. Here you can experiment with multiple things.
New Tabs: You can also add a new tab, you can use different exploration in another tab and Even you can duplicate the same report and then can make changes if needed.

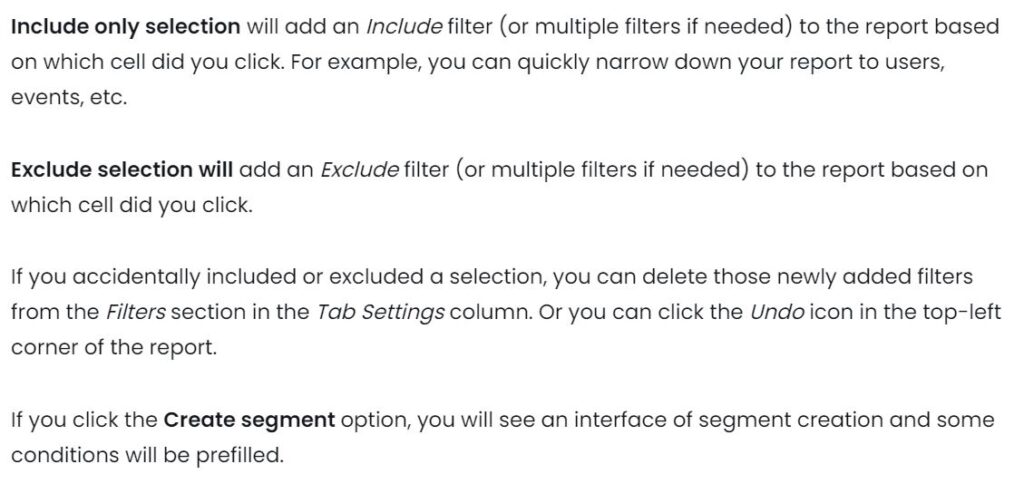
You can view additional options in a report by right-clicking on them
- Include selection
- Exclude selection
- creat segment from the selection
- View users (In user Exploration report)
I have created all these reports in Google analytics GA4 demo account

Pingback: Easy Path Exploration Report in Google Analytics 4 - Analytics Smart
Pingback: Easy Funnel Exploration Reports in Google Analytics 4 - Analytics Smart
Pingback: Cohort Analysis in Google Analytics GA4 - Analytics Smart