
A Path exploration report in GA4 allows you one more kind of analysis i.e Path Analysis report this feature allows you to dive deeper into the path observed by the visitors on the site.
In Universal Analytics use of behavioral flow, and reports were quite limited and that was rarely used as a report or for any analysis by marketers. In GA4 path analysis reports appear with some significant improvement in setup and configuration.
Exploration reports in Google Analytics 4
Table of Contents
- Exploration reports in Google Analytics 4
- Path Exploration Report in GA4
- Components Available
- Tab Settings
- The Report (Output)
Path Exploration Report in GA4
It shows the behavior of the visitors on the website/app. You can see on which events/pages visitors first interacted and then navigated to pages or events on the site after that.
This can give you an understanding of the path that your visitors take after the completion of certain actions.
Components Available
After logging in to your GA4 account on the left sidebar you can see the Path Exploration. If you choose that you will see a sample data report from your account with some configuration. If click on blank then you have to start everything from scratch.
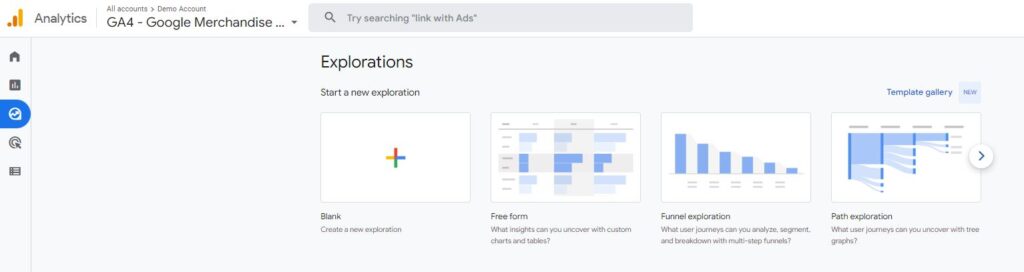
As you click on the Free form report you can see 3 sections available.
- Variables
- Tab settings (Tools)
- Output (reports generated based on tools selected in the tab)
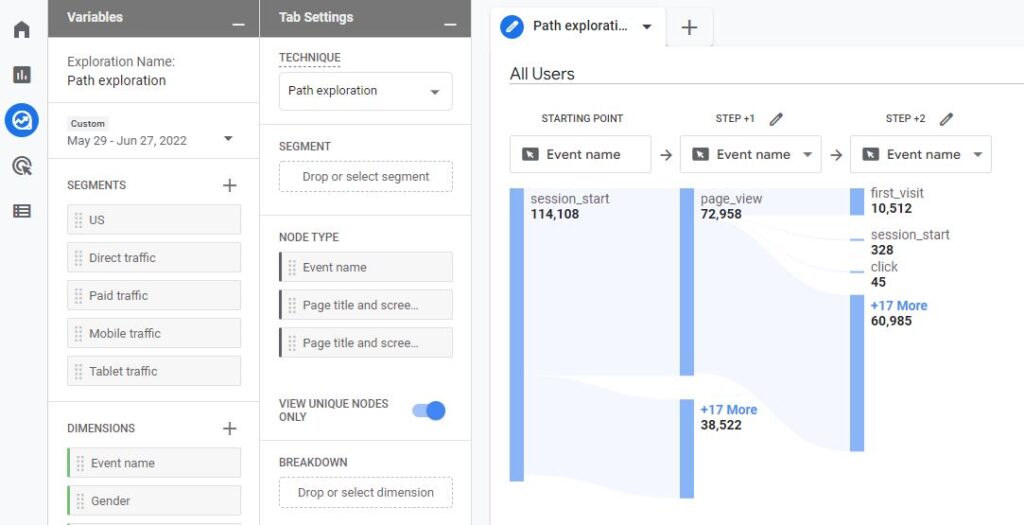
Variables
The variable is basically data points available in your analytics tracking whether it is dimensions, metrics, user property, or events property. It is the place where you decide on what data points you want to do analysis. It can be date range, segments, Dimensions, Metrics
You can change the name & Date range of your analysis report from the top-left interface.

Segments
If the analysis is needed to be done on different types of visitors like logged in, guest, or anonymous, You have to include those segments. You can choose from several segments that are already included or if you have any custom segments created.
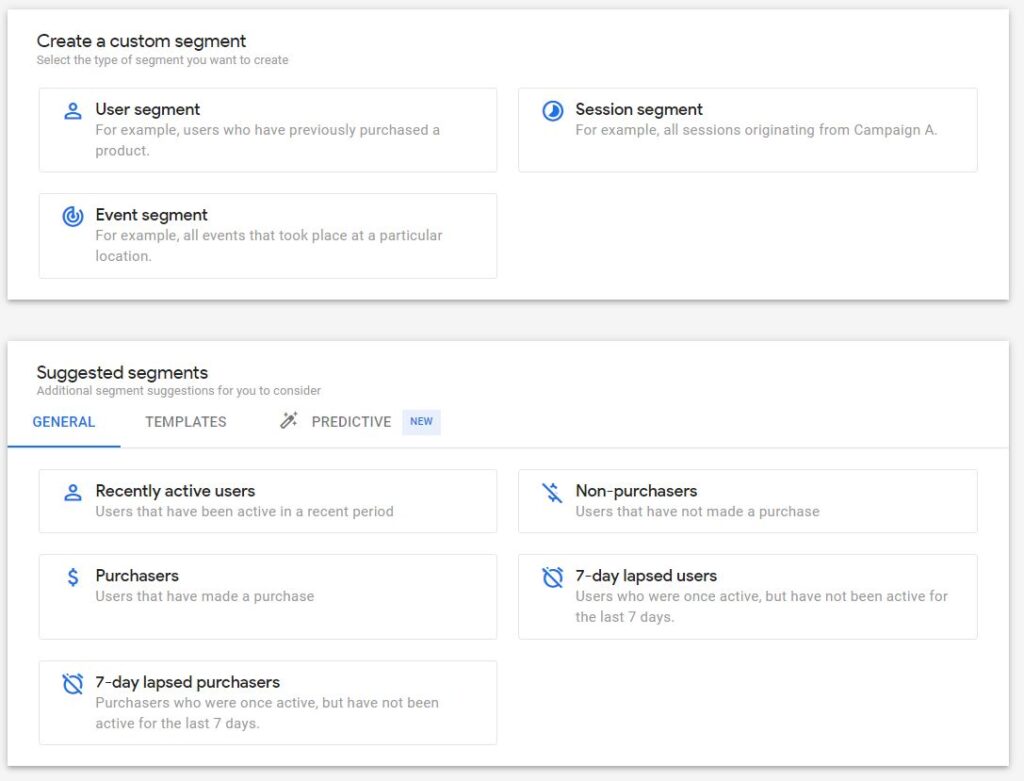
3 kinds of segmentation attributes are available
- User Segment: Here you can match user data based on certain criteria
- Session Segment: Here you can include sessions matched data points of the Audience
- Event Segment: Here you can only include event-based data points
Dimensions
Dimensions in Google Analytics are basically attributes/parameters of an event, product, transaction, users, etc. eg.
- Event Name
- Purchase
- Product Category
- Product viewed
If you wanted to include dimensions in the funnel exploration report, you have to include the dimensions in the variables column first. It can be added by clicking on the plus icon and then selecting what needs to be added.
Variable is responsible for any data input in your report. If you want to use some dimensions and segments, those data points must be included in that column. If something is missed in the process then you can add it on the fly. You have to select the date range carefully as it may impact the report as data might get sampled for the larger date range.
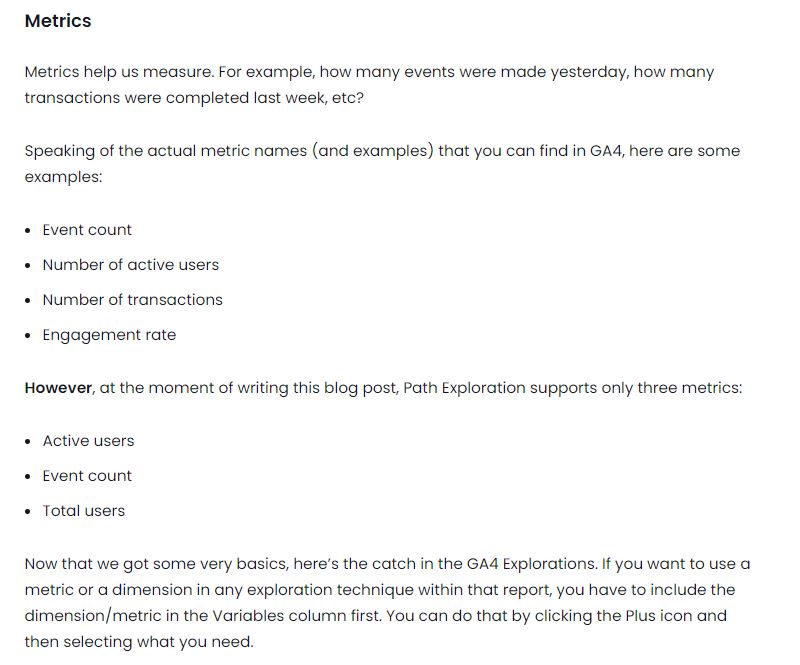
Metrics
After selecting the needed metrics/dimensions, click apply button in the top-right corner.

Tab Settings
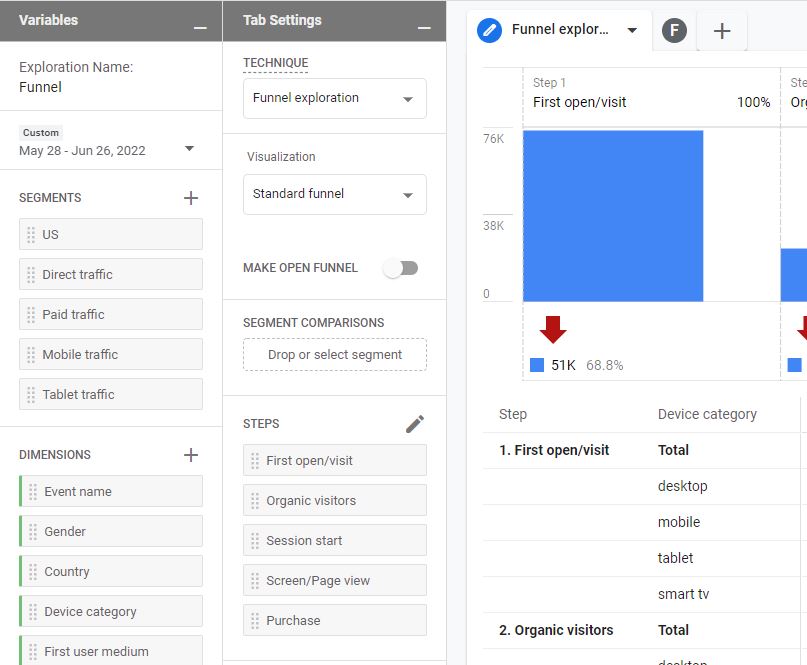
Tab settings Column is basically all the tools you can configure that will decide what the report will look like. There is a Technique drop-down menu (from there you can select the report type like Free Form, Funnel, Exploration). I have used the Google Analytics demo account for this analysis
Segment
In this, you can add a segment you want to analyze only one segment which is a subset of all data. Segment comparison is not available.
Node type
Unfortunately, you cannot change anything here. this part shows the types of nodes that you can use in the report.

“What is a node? Every branch in the path exploration visualization is a node. At the moment, the data can be split by Event name, Page title and screen name, or Page title and screen class. I wish there was one more dimension here, Page Path. Hopefully, this will be added at some point in the future.”
View Unique node only
There is a switch naming View unique node only. Suppose a visitor lands on your website and you track his activities.
- Session_start
- page_view
- page_view
- view_promortion
If you enable the View unique nodes only, then several subsequent events will be ignored and only the first one will be shown. Having the aforementioned 4 events in mind, the flow will look like this: session_start -> page_view -> view_promotion.
Breakdown
In the breakdown section, you can add a dimension that you wanted to use as an attribute to break your data. I have selected the device category dimension, here you will be able to see how different devices are performing on the pages.
If you hover your mouse on any of the touchpoints then you will be able to counts share by device category.

Values
In the values tab, you can add a metric that will get displayed (as numbers) in the path exploration report. Currently, 3 metrics types are supported.
- Active Users
- Event Count
- Total Users
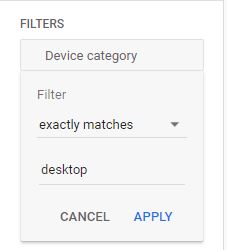
Filters
You can add filters to your data analysis to narrow it down to specific data set. But sometimes its shows unexpected behavior as I filtered for Event name contains page_view then it says no data. To apply the filter create an Event segment( here you can narrow it down to a specific event). I have narrowed it down to Desktop users and worked.
Node Filters
If you want to exclude a certain node in your visualization, do the right click on the nodes name and then Exclude node. There you can select either to exclude it from all paths or just single/this one. That filter will be added to the Node filter section

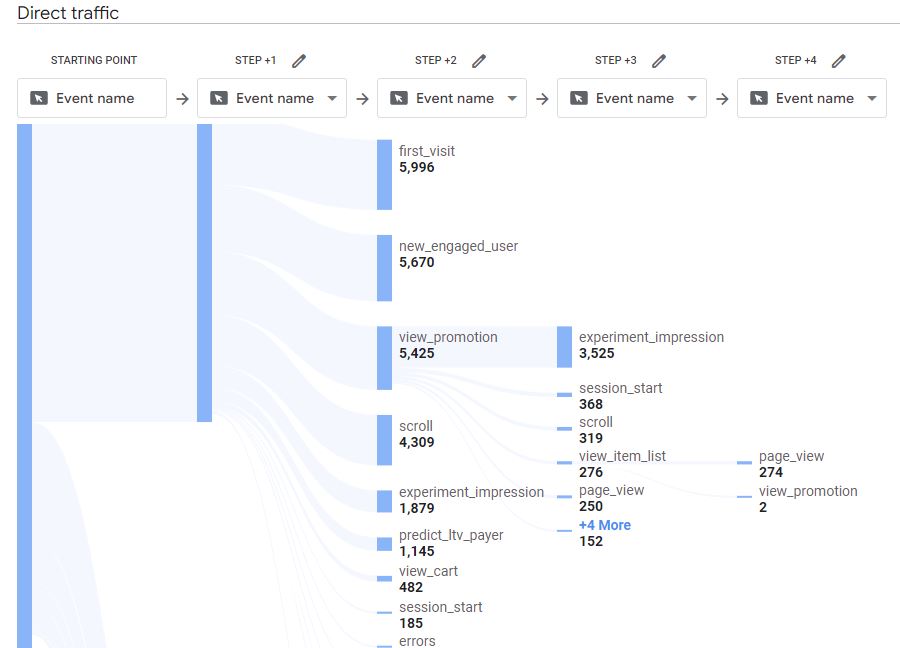
The Report (Output)
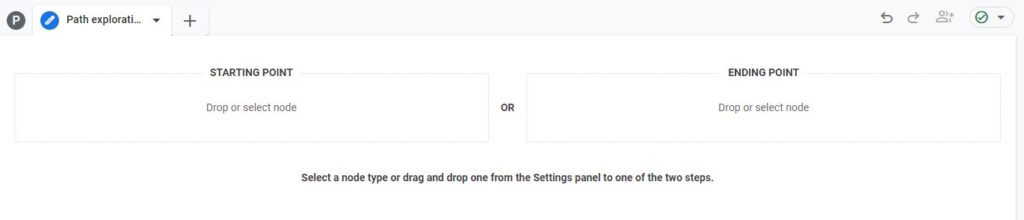
After configuring all the necessary things in the variables and Tab settings columns, the path exploration visualization will be visible. few additional things you can do.
Add New Tab if required. In each and every tab you can set up different exploration reports. Even you can duplicate and delete your reports.
In google analytics 4, you can start from the end (e.g when someone subscribes to your newsletter). Then you can see what events/pageviews occurred before a visitor subscribed.
Pingback: Easy Funnel Exploration Reports in Google Analytics 4 - Analytics Smart
Pingback: Simple Free Form Exploration Report in Google Analytics 4 - Analytics Smart
Pingback: Google Analytics GA4 Custom Dimensions is Easy - Analytics Smart
Pingback: How to Use Custom Insights in Google Analytics (GA4) - Analytics Smart
Pingback: Cohort Analysis in Google Analytics GA4 - Analytics Smart