A Funnel Exploration report is always the priority report for anyone using a web analytics tracking tool. Only funnel report in Universal Analytics was related to Ecommerce ie. shopping and checkout funnel and there is no custom funnel you can create in UA.
But with the launch of GA4, Google Analytics provided the functionality of custom funnel creation based on events flow by providing Funnel Exploration. It allows you to build funnel reports based on events been tracked.
If you wanted to see how many visitors from which channel go from viewing a product to purchasing? wanted to include certain touchpoints in the funnel? This is what has always been wanted by analytics experts in GA and was complex in Universal analytics.
Exploration reports in Google Analytics 4
- Path exploration report in Google Analytics 4
- Free form report in Google Analytics 4
- Segmentation Overlap Report
Table of Contents
Components Available
After logging in to your GA4 account on the left sidebar you can see the Funnel Exploration. If you choose that you will see a sample data report from your account with some configuration. If click on blank then you have to start everything from scratch.
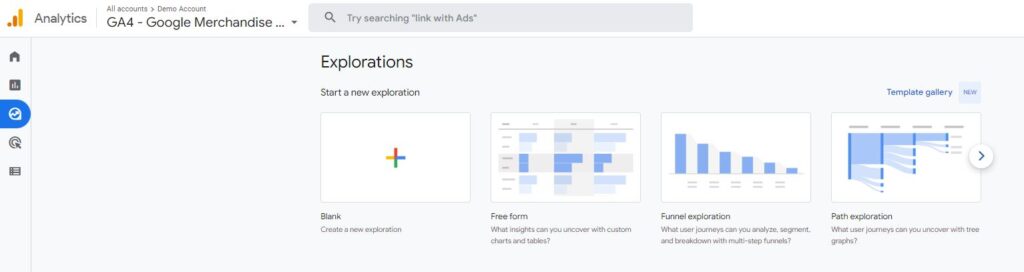
As you click on the Free form report you can see 3 sections available.
- Variables
- Tab settings (Tools)
- Output (reports generated based on tools selected in the tab)

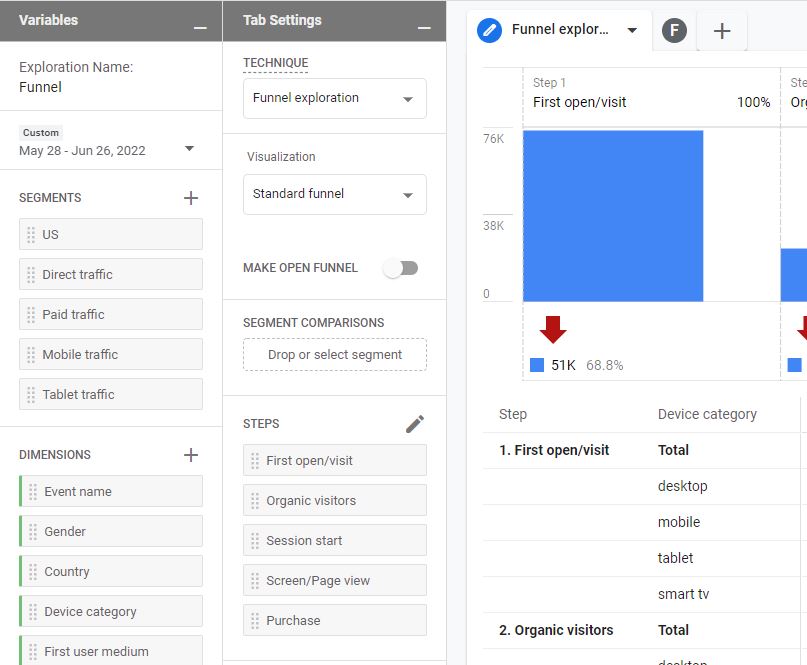
Variables
The variable is basically data points available in your analytics tracking whether it is dimensions, metrics, user property, or events property. It is the place where you decide on what data points you want to do analysis. It can be date range, segments, Dimensions, Metrics
You can change the name & Date range of your analysis report from the top-left interface.

Segments
If the analysis is needed to be done on different types of visitors like logged in, guest, or anonymous, You have to include those segments. You can choose from several segments that are already included or if you have any custom segments created.
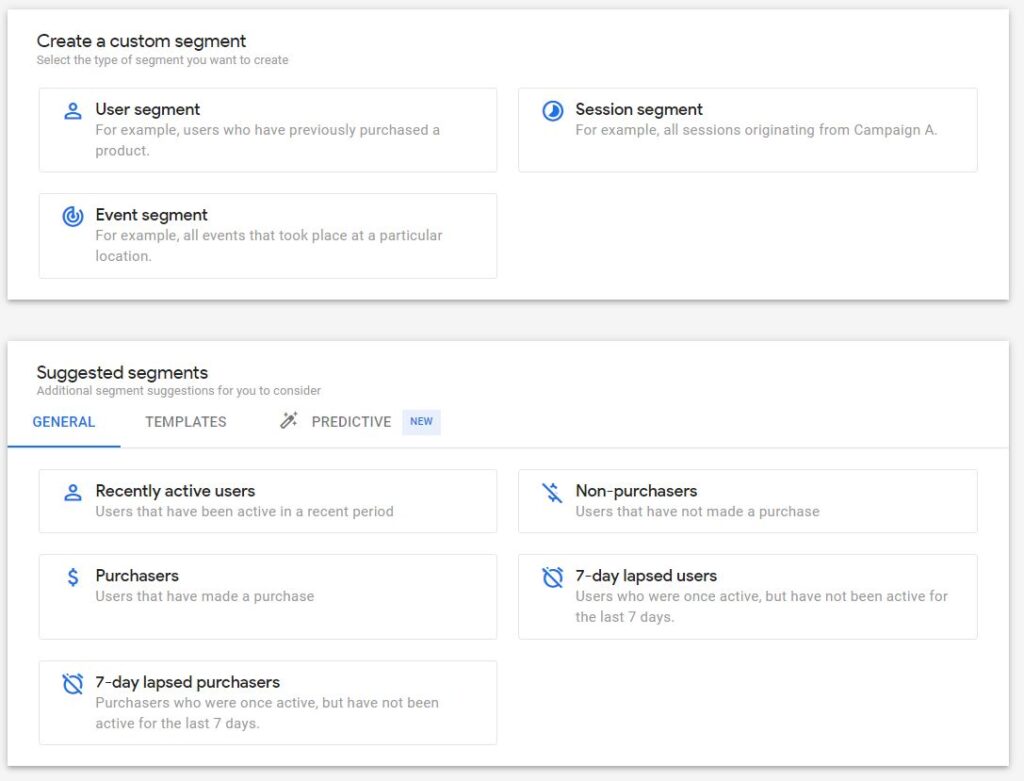
3 kinds of segmentation attributes are available
- User Segment: Here you can match user data based on certain criteria
- Session Segment: Here you can include sessions matched data points of the Audience
- Event Segment: Here you can only include event-based data points
Dimensions
Dimensions in Google Analytics are basically attributes/parameters of an event, product, transaction, users, etc. eg.
- Event Name
- Purchase
- Product Category
- Product viewed
If you wanted to include dimensions in the funnel exploration report, you have to include the dimensions in the variables column first. It can be added by clicking on the plus icon and then selecting what needs to be added.
Variable is responsible for any data input in your report. If you want to use some dimensions and segments, those data points must be included in that column. If something is missed in the process then you can add it on the fly. You have to select the date range carefully as it may impact the report as data might get sampled for the larger date range.
Tab Settings
Tab settings provide the tools to configure what the report will look like. First, there is a technique block drop down from where you have to select a report type from Free Form, Funnel, Path Analysis. I have selected the Funnel exploration for this report.
Visualization
Two options are available here:
- Standard Funnel
- Trended Funnel
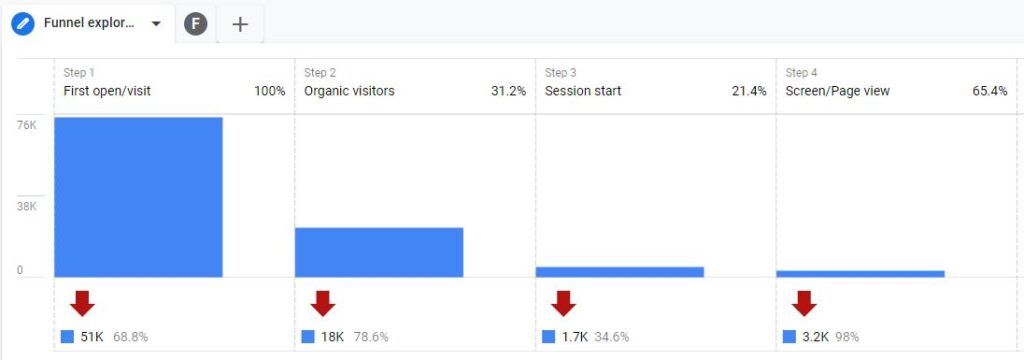
Standard Funnel is the one that people are already aware of and most used. Its bar chart for the steps configured as part of the funnel shows how many people completed those steps.
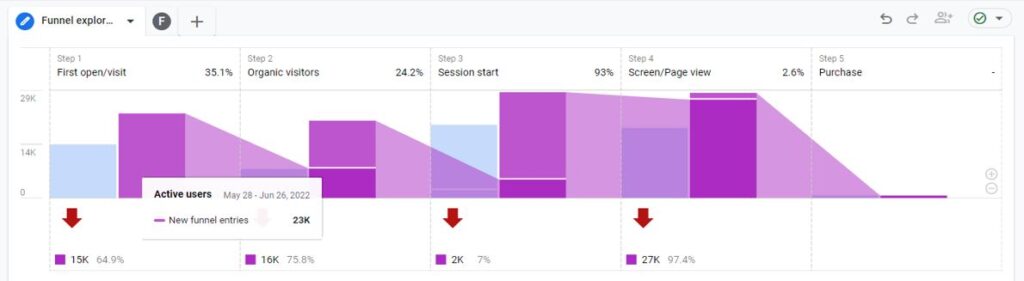
Sometimes it is difficult to understand how the funnel is performing over time. That’s why the second option(Trended Funnel) becomes useful.
Every funnel step gets its own line in the chart and we can understand how it gets changed over time. As you click on a certain line in the chart, it will stay highlighted. If you want to see only a particular line, then you can click on tabs visible over the chart.

Open Funnel
Default Funnel type is closed in GA4, It means that if a visitor enters the funnel at the 2nd step, then that user is not counted in the funnel.
If you want to see if a visitor/ user enters the funnel “at any step” then you can make it an open funnel

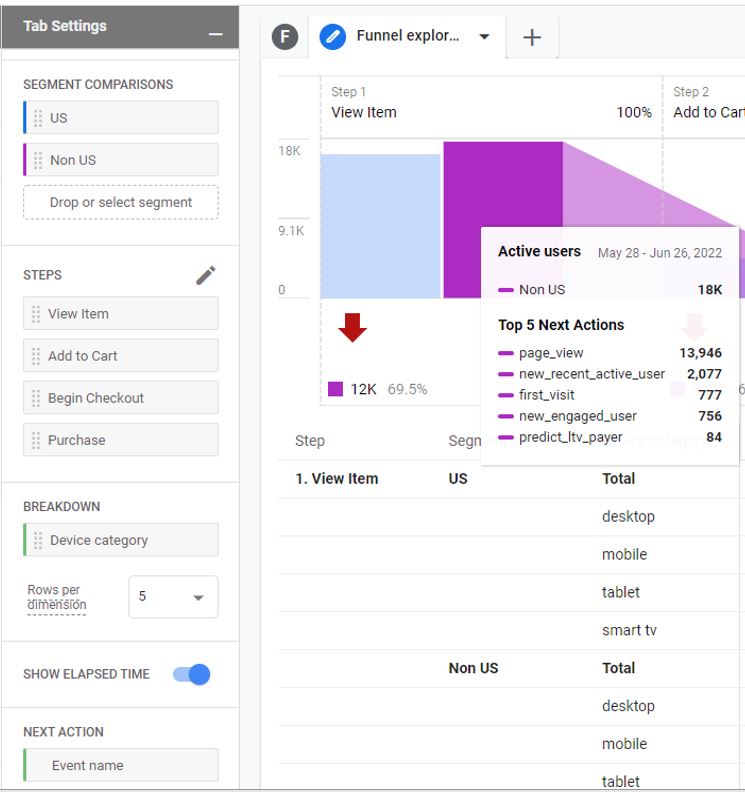
Segment comparison
In segment comparison sections available, someone can include at most 4 segments that should already be included in the segments section of the Variables Tab.
You can either choose double click on the segment in the variable tab to add it to tab settings automatically or just drag and drop. If you have one segment added for comparison a new Pivot field will appear. This field is responsible for the placement of segments in the table. There are 4 options in this: first row, last row, first column, and last column.
Example Report:
- Custom Segment: User segment
- Country ID does not exactly match the US

The new segment is automatically added to the segment comparison section. Each segment will now get its own bar in the funnel chart. Further breakdown table below shows nested values.
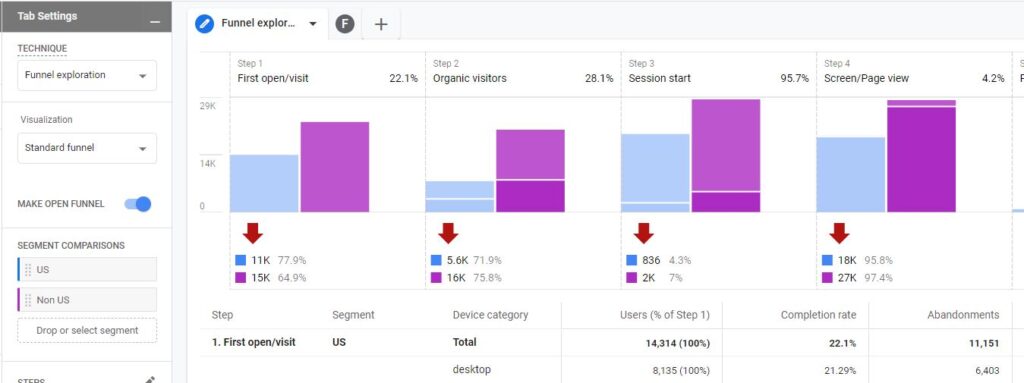
Now there is a new more convenient way to use the standard funnel report for segment comparison (because you can hover on a bar in the chart of the particular segment and that entire segment will be highlighted).
As for trended funnel, each step gets an individual line in the chart. If comparing 2 segments and the number of lines gets doubled. If you have had 5 steps and compare 3 segments, then lines will be 15 in a single chart, which can get difficult to visualize and comprehend.
Shopping Funnel Steps
Steps in the funnel you can define based on the business definition and events tracking configured. I am using the Google Analytics demo account for this report generation.

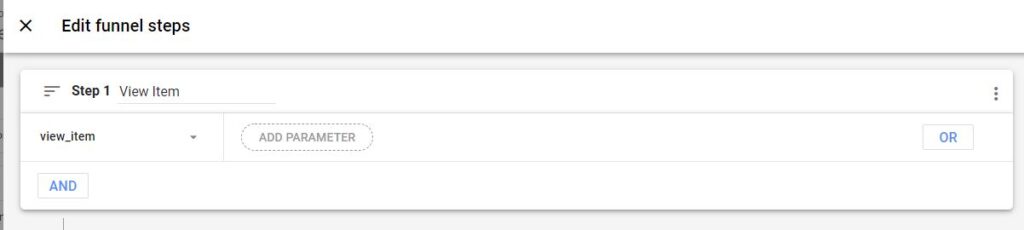
If you want to edit steps you can add/remove them by clicking on the pencil icon. In each step, you can enter the name/label for the step, and naming has no impact on the data.
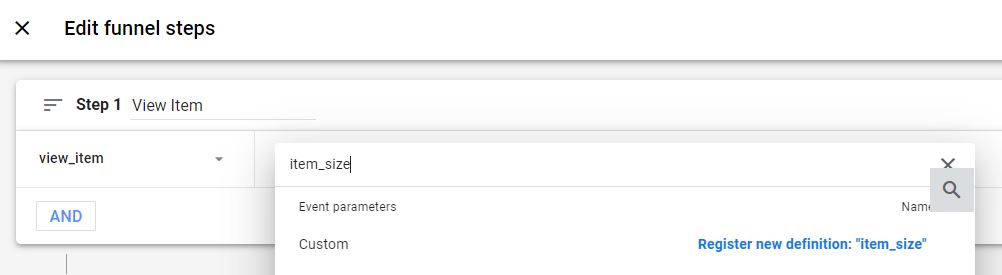
You can Add New conditions and select from dimensions that are available by default and registered as custom definitions in your property. You can search the dimension in the search bar

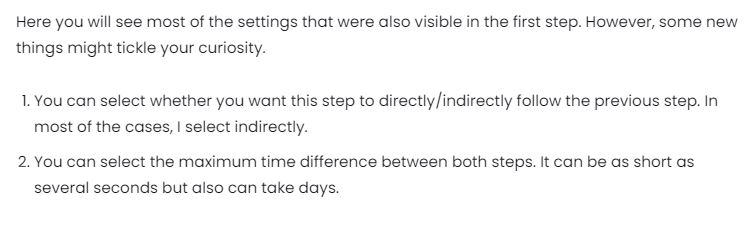
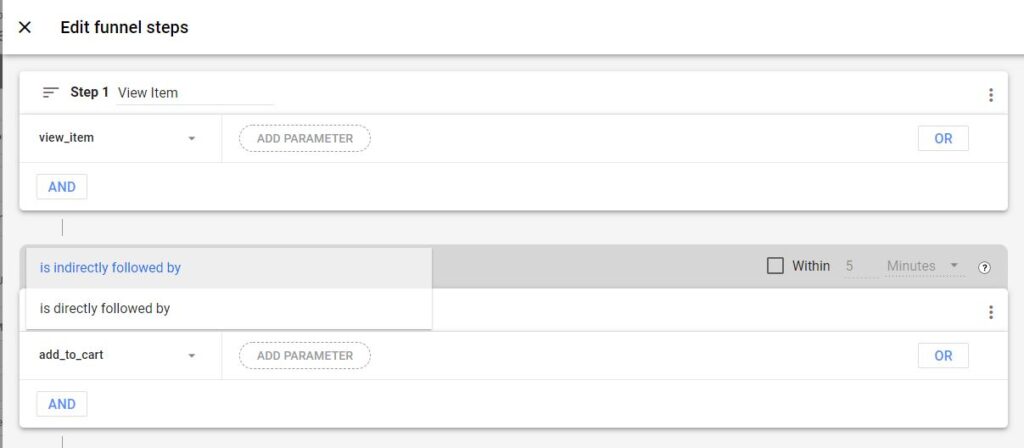
Once you configured the first step then you can proceed to the 2nd step configuration with the logic of AND & OR
And if try to use some parameter that is not registered as a custom dimension, you will see the (register new definition) label next to it.
If there is a requirement to delete a particular condition, you can do so by clicking the x icon on the right side of that condition. There are also additional options in the top-right corner.
- Copy Step
- Remove Step
- Add Step below
- Add step Above

To add another step in the funnel, click on Add Step below

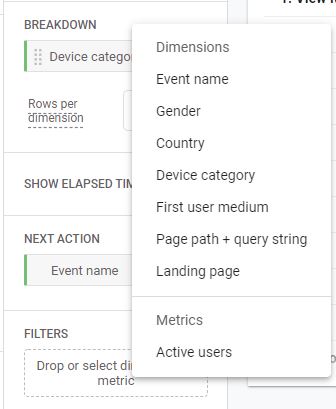
Breakdown
In the funnel chart created here, you can see the data is broken down into a single dimension. I have selected Device Category to see how the funnel is completed with Different devices.
If the dimension cardinality is huge then there will be several possible values you can select the number for rows per dimension to display.
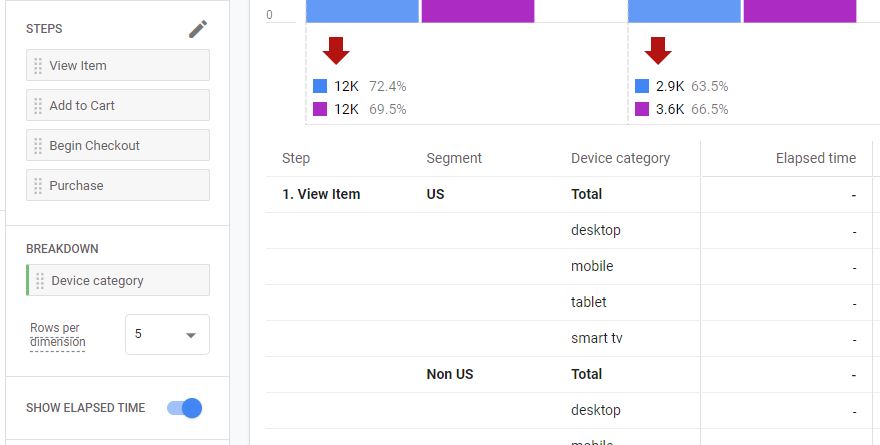
Elapsed time
If you wanted to see how much time on average your visitor/users need to proceed from 1st step to 2nd step, you have to enable the Show Elapsed TIme.

Next Action in Reporting
If you want to see other events that visitor does after particular steps? Drag the Event name dimension to the Next action section. Then you can hover your mouse over any bar in the chart and you will see a popup that shows the next 5 most popular events that a visitor did immediately after the steps defined
Filters
If you need to narrow down the data that is used in the funnel exploration report. You can apply filters:
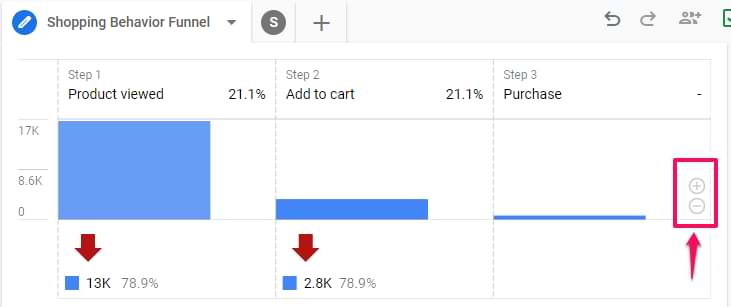
Report Generation
After the report is generated, you can interact with it and dig deeper.
If you find the difference between some steps is too large (for example, step 1 contains 5000 users and step 2 contains 150), you can zoom in. Click the Plus icon in the corner of the bar chart. Also, you can hover your mouse over the chart and scroll up/down to adjust.
If you right-click on any bar in the chart generated, you can create a segment from those users or you can view them in the User Explorer report.


Pingback: Easy Path Exploration Report in Google Analytics 4 - Analytics Smart
Pingback: Simple Free Form Exploration Report in Google Analytics 4 - Analytics Smart
Pingback: Google Analytics GA4 Custom Dimensions is Easy - Analytics Smart
Pingback: Dive into Segment Overlap Report In Google Analytics 4 - Analytics Smart
Pingback: Cohort Analysis in Google Analytics GA4 - Analytics Smart